Download
1 / 23
230 likes | 237 Views
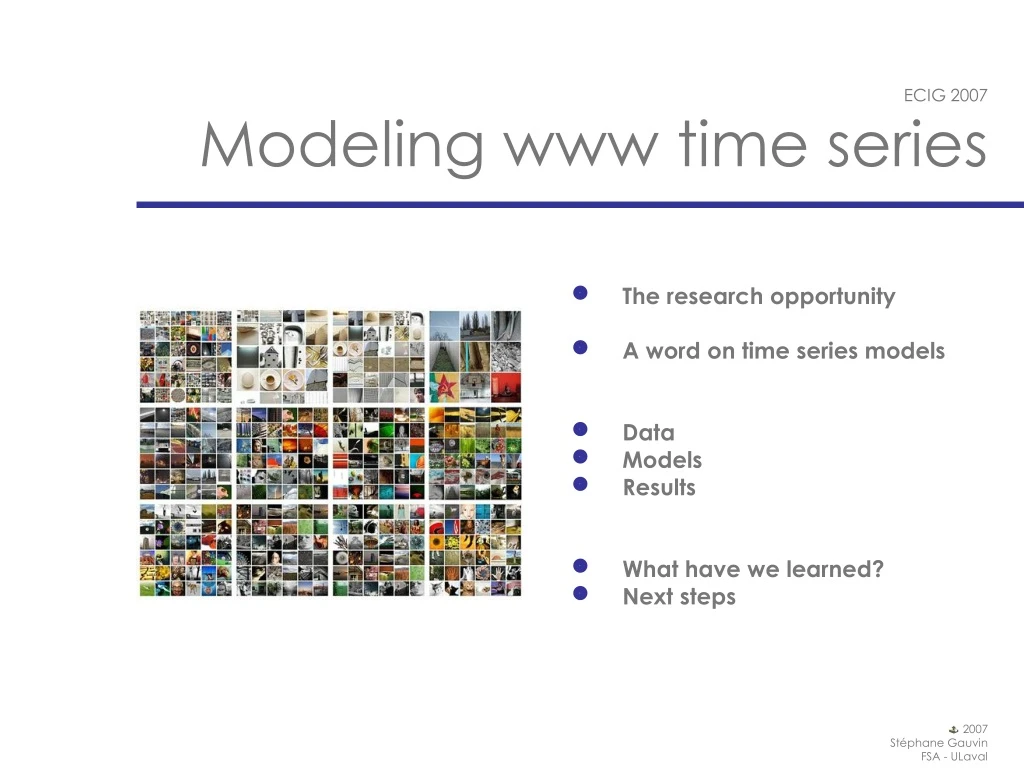
This research opportunity explores the measurement and forecasting of real-world opinions by listening to the digital sphere. Using time series models, data mining techniques, and singular spectrum analysis (SSA), we extract trends and insights from the digital sphere to understand dominant voices and signal strength. Results and robust methods are discussed, along with future steps and potential applications in various industries.

E N D
ECIG 2007Modeling www time series • The research opportunity • A word on time series models • Data • Models • Results • What have we learned? • Next steps 2007 Stéphane Gauvin FSA - ULaval
Research opportunity • CSR: Organizations manage a widening set of stakeholders • Power of exit • Power of voice • The digital sphere has become the Übermedia • Voices are innumerable • Which voice will become dominant? (eg: anti-smoking, fat lawsuits, vegetarianism) • General question is: • Can we measure and forecast real-world opinions merely by listening to the digital sphere? • Today’s question is: • How strong is the signal in the digital sphere? 2007 Stéphane Gauvin FSA - ULaval
A word on timeseries models • Marketing is concerned with theory building • Data mining is atheoretical • Trends are as a nuisance • First step is to take first and second differences • VAR and/or co-integration • Dekimpe & Hanssens IJRM 2000, WP 2006 • Franses JMR 2005 2007 Stéphane Gauvin FSA - ULaval
Into the looking glass • The digital sphere is invisible. It is queried (googled) • We all google all the time to retrieve specific instances • Swammer searches to count instances 2007 Stéphane Gauvin FSA - ULaval
Swammer • Build an intelligent set of queries to compute index • Shown to be close to survey data 2007 Stéphane Gauvin FSA - ULaval
Illustrative data 2007 Stéphane Gauvin FSA - ULaval
Robust or else 2007 Stéphane Gauvin FSA - ULaval
Storms obscure trends 2007 Stéphane Gauvin FSA - ULaval
French presidental 2007 Stéphane Gauvin FSA - ULaval
Royal / Sarkozy 2007 Stéphane Gauvin FSA - ULaval
Industry data 2007 Stéphane Gauvin FSA - ULaval
Models • Parametric trend models • Robust estimator (M-reg) 2007 Stéphane Gauvin FSA - ULaval
SSA • Singular Spectrum Analysis (SSA) (Golyandina et al. 2000) • Non parametric applications to the digital sphere • Bagchi & Mukhopadhyay (2006) (overall growth of the Internet) • Papagiannaki et al. (2005) (overall backbone traffic) • SSA applications • Ghil et al. (2002) (climatology) • Balazs & Chaloupka (2004) (biology) • Koelle & Pascual (2004) (epidemiology) • Antoniou et al. (2003) (wavelet model / Internet traffic) • Edwards (2006) (dissertation / US Navy related series) 2007 Stéphane Gauvin FSA - ULaval
Caterpillar-SSA It is based on the idea of time series embedding into finite-dimensional space and following application of singular value decomposition (SVD) to the trajectory matrix (that is the result of time series embedding). The components of SVD are uniquely juxtaposed to the additive components of the original time series. Thereby we obtain the decomposition of the time series into additive components together with the information about them. This information is represented by the collection of singular vectors and signular values of the SVD. 2007 Stéphane Gauvin FSA - ULaval
Caterpillar-SSA • Opérationnellement • Construire une matrice de vecteurs décalés (dim L/2) • Extraire les valeurs propres • Regrouper les eigen-vecteurs en trois groupes • Tendance (auto-corrélations varient lentement) • Cycles (auto-corrélations varient rapidement) • Bruit (cycles de fréquence arbitraire) 2007 Stéphane Gauvin FSA - ULaval
Caterpillar-SSA 2007 Stéphane Gauvin FSA - ULaval
Results - presidential 2007 Stéphane Gauvin FSA - ULaval
Results - presidental 2007 Stéphane Gauvin FSA - ULaval
Results - Industry 2007 Stéphane Gauvin FSA - ULaval
Results - Industry 2007 Stéphane Gauvin FSA - ULaval
Results - Industry 2007 Stéphane Gauvin FSA - ULaval
Conclusions • Good signal-to-noise ratio • Estimation must be robust • SSA • Trend is easily extracted and follows closely the original series • Not robust to extreme values • M-NL • Dominant technique for large scale scenario • Sometimes, sensitive to seed values 2007 Stéphane Gauvin FSA - ULaval
Next • Build a tracking system • M-NL to signal shifts • autoSSA to produce rich trend summaries • Explore forecasting models • Fitting and forecasting are not the same • Longer series to test rolling holdout samples • Validity issues • Anecdotal evidence of close tracking • Presidential series raises questions as to what the signal means 2007 Stéphane Gauvin FSA - ULaval