Download
1 / 9
230 likes | 763 Views
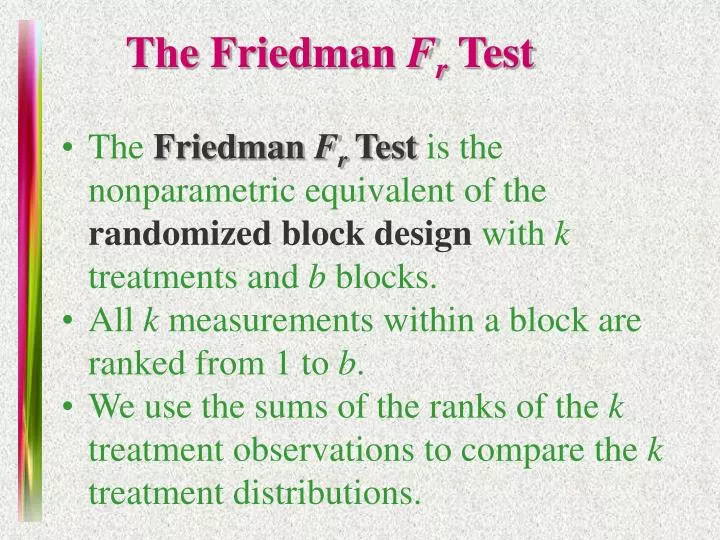
The Friedman F r Test. The Friedman F r Test is the nonparametric equivalent of the randomized block design with k treatments and b blocks. All k measurements within a block are ranked from 1 to b .

E N D
The Friedman Fr Test • The Friedman FrTest is the nonparametric equivalent of the randomized block design with k treatments and b blocks. • All k measurements within a block are ranked from 1 to b. • We use the sums of the ranks of the k treatment observations to compare the k treatment distributions.
The Friedman Fr Test • Rank the k measurements within each block from from 1 to k. Tied observations are assigned average of the ranks they would have gotten if not tied. • Calculate • Ti = rank sum for the ith treatment i = 1, 2,…,k • and the test statistic
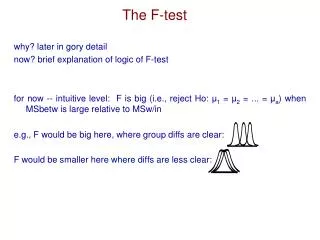
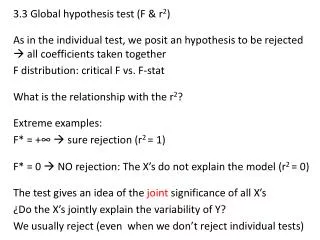
The Friedman Fr Test H0: the k treatments are identical versus Ha: at least one distribution is different Test statistic: Friedman Fr When H0 is true,the test statistic Fr has an approximate chi-square distribution with df = k-1. Use a right-tailed rejection region or p-value based on the Chi-square distribution.
Example A student is subjected to a stimulus and we measure the time until the student reacts by pressing a button. Four students are used in the experiment, each is subjected to three stimuli, and their reaction times are measured. Do the distributions of reaction times differ for the three stimuli?
Reaction Times Rank the 3 measurements for each subject from 1 to 3, and calculate the three rank sums. H0: the distributions of reaction times are the same Ha: the distributions differ in location
Reaction Times H0: the distributions of reaction times are the same Ha: the distributions differ in location Do not reject H0. There is insufficient evidence to indicate that there is a difference in reaction times for the three stimuli. Rejection region:Use Table 5. For a right-tailed chi-square test with a = .05 and df = 3-1 =2, reject H0 if H 5.99.
Summary • The Kruskal-Wallis H test is the rank equivalent of the one- way analysis of variance F test. • The Friedman Fr test is the rank equivalent of the randomized block design two-way analysis of variance F test.
Key Concepts Nonparametric Methods These methods can be used when • the data cannot be measured on a quantitative scale, or when • the numerical scale of measurement is arbitrarily set by the researcher, or when • the parametric assumptions such as normality or constant variance are seriously violated.
Key Concepts The Friedman Fr Test: Randomized Block Design 1. Rank the responses within each block from 1 to k. Calculate the rank sums T1, T2, ¼, Tk, and the test statistic 2. If the null hypothesis of equality of treatment distributions is false, Fr will be unusually large, resulting in a one-tailed test. 3. For block sizes of five or greater, the rejection region for Fr is based on the chi-square distribution with (k- 1) degrees of freedom.