Download
1 / 28
280 likes | 447 Views
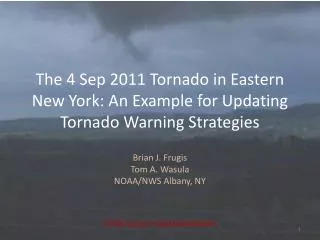
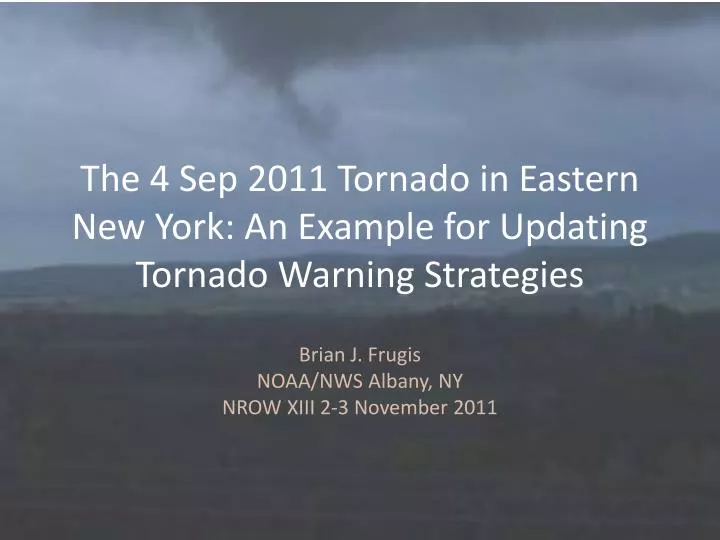
The 4 Sep 2011 Tornado in Eastern New York: An Example for Updating Tornado Warning Strategies. Brian J. Frugis NOAA/NWS Albany, NY NROW XIII 2-3 November 2011. CSTAR IV & Motivation for Study.

E N D
The 4 Sep 2011 Tornado in Eastern New York: An Example for Updating Tornado Warning Strategies Brian J. Frugis NOAA/NWS Albany, NY NROW XIII 2-3 November 2011
CSTAR IV & Motivation for Study • New Tornado Climatology was developed over the summer of 2010 for the Northeastern US with CSTAR work by undergrad UAlbany students • A goal of CSTAR IV is to develop/update tornado warning strategies using the new 8 bit high resolution radar data • V-R shear relationship has been an effective method for predicting tornadic development, however, this is based off of 4-bit radar data
Updated Tornado Climatology by CWANumber of Tornadoes for 1981 – 2010 Normal Period 19 23 47 100 63 67 124 81 205 222
Number of tornadoes from 1981-2010=100 Average number per year is 3.33
Number of Tornadoes = 100 79% are weak (EF0/EF1), 16% are strong (EF2/EF3) and only 5% are violent(EF4/EF5)
Previous Work • LaPenta (2000) led a COMET study on V-R shear relationship for Northeastern United States tornadoes • Collaborate project between UAlbany and NWS Albany • This study created nomograms for operational use based on a linear relationship between gate-to-gate shear and the strength of the rotational velocity of the mesocyclone
V-R Shear Relationship • Maximum observed gate-to-gate shear below 3 km was found to be useful in identifying tornadic storms (LaPentaet al. 2000) • S=Vr/(D*1800) • Shear (S) is measured in units of s-1, rotational velocity (Vr) in knots and D is the diameter of which S is calculated in n mi.
Accounting for Varying Shear Values With 4-bit data, adjacent pixels are 0.5 n mi apart within 30 n mi from the radar. This distance becomes 1.0 n mi at 60 n mi away from the radar due to beam spreading Because of this, D is variable depending on range from radar and must be normalized In the LaPenta study, D was set to 0.5 n mi for areas within 30 n mi of radar and adjusted for areas further away (LaPenta et al, 2000)
Maximum Velocity Differential of Mesocyclone (Vm) • Determine strength of large-scale mesocyclone • Based off “Mesocyclone Recognition Guidelines” (Andra et al. 1994) • Uses a 3.5 nm mesocyclone width Image from 1998 Mechanicville, NY F3 Tornado, courtesy of LaPenta, et al. 2000
Legacy 4-bit V/SRM Products • Resolution: 1 km (0.54 nm) by 1 degree • Range: 124 nm • 16 data levels: -64 kts to +64 kts An example of 4-bit reflectivity (Z) image from KENX from 2123z 4 Sept 2011
8 Bit V/SRM Products • Introduced in late 2002/early 2003 with AWIPS build 5.2.1 • Resolution: 0.25 km (0.13 nm) by 1 degree • Range: 124 nm (no change) • 256 data levels (28): -123 kts to +123 (using standard setup) An example of 8-bit reflectivity (Z) image from KENX from 2123z 4 Sept 2011
Super Resolution 8 bit V/SRM Products • Introduced in Spring-Summer 2008 with RPA/RDA Build 10.0 • Resolution: 0.25 km (0.13 nm) by ½ degree • Range: 162 nm • 256 data levels (28): -123 kts to +123 (using standard setup) An example of 8-bit super resolution reflectivity (Z) image from KENX from 2123z 4 Sept 2011
Advantages of New High Res Data • With the 8-bit high res data, we no longer have to adjust D for range when using the V-R shear technique • This is because going from the mid point to mid point of adjacent pixels is 0.5 n mi or less for up to 60 n mi from the radar • The higher resolution data allows more subtle features to be resolved • Higher velocity values can be calculated (up to 128 kts in normal setup for 8 bit as compared to 64 kts for 4 bit)
4 Sept 2011 Tornado • Rated EF1 with top winds of 110 mph by NWS Albany Survey Team • Formed at 2120z near Florida, NY • Up to a half-mile wide through Cranesville, NY • Dissipated at 2135z near Glenville, NY • On the ground for 7 miles KENX 0.5° Z Loop from 4 Sept 2011 between 2109z and 2146z
Using Spectrum Width as an Indicator of Tornadic Development KENX 0.5° Reflectivity Loop w/TVS KENX 0.5° Spectrum Width Loop
Calculating Legacy V-R Shear • 4 bit KENX SRM 4 Sept 2011 – 2123z • Since distance from RDA=20 nm, shear can be measured with 0.5 n mi diameter • Vr =43.0 kts • S=0.0450 s-1
Maximum Velocity Differential of Mesocyclone (Vm) SRM Cross-Section from KENX Radar 2123z 4 Sept 2011 – About 20 n mi from RDA Mesocyclone Circulation Tornadic Circulation Image is from Vertical Slice Pane from AWIPS FSI Maximum Velocity of Mesocyclone (Vm) = 55 kts
4 Sept 2011 Tornado S=.0450 s-1 Vm=55 kts (LaPenta et al., 2000)
4 Sep 2011 2123Z KENX SRM Legacy 4-bit: (1 km x 1 degree) Super Resolution 8 bit: (0.25 km x 0.5 degree) Vr=43.0 kts, D=0.5 n mi, S=0.0450 s-1 Vr=53.9 kts, D=0.5 n mi, S=0.0626 s-1
Comparing Storm Types • LaPentaet al. (2000) found that supercells were responsible for producing tornadoes in about half (49%) of the storms examined • 67% of the storms were associated with a bow echo and 19% had a boundary interaction • The 4 Sept 2011 storm is a good example of a boundary interaction and a bow echo as well
Future Work • Higher resolution data will require a new nomogram to be created • Scale of shear values (S) will likely change • With 8 bit data, gate-to-gate shear can be calculated without having to adjust for range from radar • Will allow for faster identification and quicker warnings • Future work over the next year will study all tornadoes since start of 8-bit data • Also, null cases (non-verified TOR) will be examined as well • Storm type will be examined as well to see if our trends fit what LaPentaet al. found in 2000
Limitations/Potential Issues • Knowing what was really a tornado can be somewhat subjective • Weak tornadoes common to this area don’t always show much different damage than thunderstorm winds/microbursts • NCDC StormData doesn’t allow for “landspouts” • Radar doesn’t always show rotation • Not all classified tornadoes show classic rotation couplet on radar • Radar data can be limited or affected by terrain • Beam may overshoot low-level features farther away from RDA • Many parts of the Northeast are affected by beam blockage
Items to Track in Spreadsheet for Study • Date/Time/Location of Tornado • Radar Site Used/VCP/Range from Radar • Vr, S, Vm • Storm Type and Tornado Formation • Boundary Interaction? Supercell with hook echo? • Meso/TVS Present? • Other Unique/Curious Items • Large Hail, Strong LLJ, Max Reflectivity, etc.
Questions? Any questions or comments? Brian.Frugis@noaa.gov