Download
1 / 18
180 likes | 331 Views
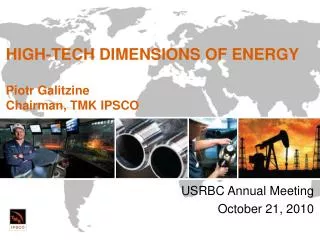
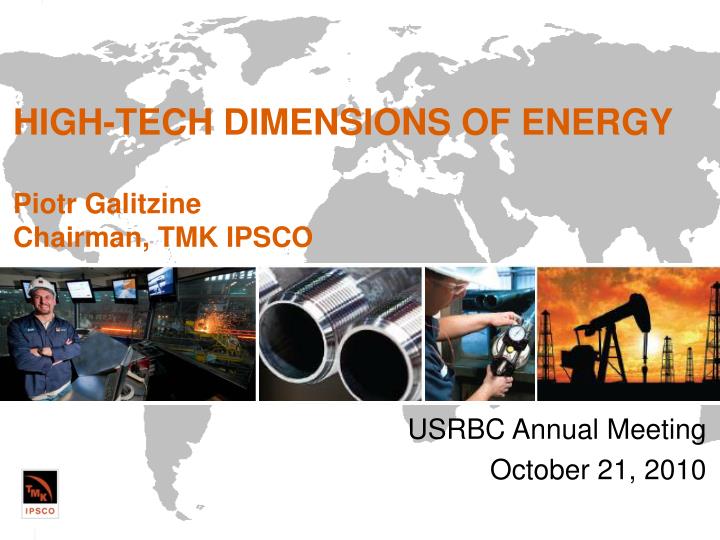
HIGH-TECH DIMENSIONS OF ENERGY Piotr Galitzine Chairman, TMK IPSCO. USRBC Annual Meeting October 21, 2010. TMK Global Strength. 22 production sites 46,000 employees 6.4M tons of pipe-making capacity ~ $5 billion annual revenue.

E N D
HIGH-TECH DIMENSIONS OF ENERGYPiotr GalitzineChairman, TMK IPSCO USRBC Annual Meeting October 21, 2010
TMK Global Strength • 22 production sites • 46,000 employees • 6.4M tons of pipe-making capacity • ~ $5 billion annual revenue 3
TMK Uniquely Positioned to be the Leading Supplier of Energy Tubulars The United States and Russia are the global leaders in oil and gas drilling. TMK’s strategic positioning made it the steel tubular industry leader in 2009, selling over 3 million tons in a down market. TMK’s product mix is geared to meet the needs of the energy industry. Energy 70%
TMK IPSCO Poised for Growth Today drilling is centered on the shale plays which are believed to contain as much as a third of the United States’ technically recoverable gas resources. Top 5 States = 76% of Rig Count Source: EIA Modern Shale Gas Primer, April 2009 Smith Technologies
Today’s Energy Environment New Market Dynamics Driven by technological advances in horizontal drilling and hydraulic fracturing, the natural gas industry has become more efficient—producing more natural gas using fewer rigs. Since no increase in natural gas consumption is part of the Short-Term Energy Outlook, the natural gas rig count may never return to 2007 – 2008 levels. Source: EIA Short-Term Energy Outlook, Smith Technologies
Today’s Energy Environment Lower Break-even Costs Encouraging Drilling The industry has traditionally viewed $5 to $6 as the economic drilling price of gas, but a recent Credit Suisse study estimates surprisingly low break-even costs for the major shales. Lower break-even costs will allow the higher rig count to continue despite lower natural gas price forecasts. 8 Source: EIA Short Term Energy Outlook, Credit Suisse
Hydrofracking Hydrofracturing: 3,000 psi/5,000 psi/25,000 psi Frequency: 10X/25X Aquifer ULTRA - SF 5,000 – 10,000 ft ¼ mile radius Multiple frac zones 8,000 – 12,000 ft
Advances in Steam Assisted Gravity Drained (SAGD) Wells (e.g., Cenovus Energy Inc., Calgary) Wedge Wells Steam out Oil In Two Staged Pairs (final) With Wedge Well Two Staged Pairs (Initial) SAGD Pair (side view)
Another approach to increasing flow pathways in the zone of hydrogen recovery Slot-Sawing: Cutting Cable Oil In Slit Area
Today’s Energy Environment Oil Driving Growth in Rig Count Both the oil and gas rig counts have rebounded in 2010, but on the back of high crude oil prices, the oil rig count has grown to levels unseen since 1991. 21% 18% 32% 26% The technologies pioneered in the gas shales have been used to unlock the oil shales. The Bakken shale of North Dakota has a 96% horizontal rig count. OK KS Top 5 States = 83% of oil rig count NM ND TX Source: Smith Technologies Rig Count
New Challenges North American Capacity Increasing Competitors continue to announce tubular and finishing capacity additions over the next two years. By the end of 2012, North America will potentially have enough capacity to support 2,400 rigs. Source: Company estimates
2011 Early Outlook Commodity Prices Resembling 2010 The EIA has held the crude oil and natural gas price forecasts in the same range as 2010. Oil prices remain stronger than recent years while natural gas prices are lower due to the large supply of accessible shale gas. Source: EIA Short-Term Energy Outlook, September 2010 15
Oil Sands 21% 12% 11% 3% 3% 2011 Early Outlook Canadian Oil Sands Gaining Momentum Today Canada is the source of over 20% of U.S. crude oil imports; it’s estimated that half of Canadian imports come from the oil sands. The IHS Cambridge Energy Research Associates project that the oil sands will account for 36% of U.S. oil imports by the year 2030. Today, four Latin American countries supply another 30% of U.S. crude oil imports. . . Source: New York Times, EIA
TMK IPSCO’s 2011 Outlook Innovative Solutions Driving Growth TMK IPSCO has a demonstrated ability to engineer customized solutions allowing our customers to access new markets like the shale plays. Our team of technical experts is continually working to provide the best value in pipe and premium connections to the energy industry as it evolves.
TMK IPSCO’s Long-term Prospects Natural Gas – The Key to a Greener Future Natural gas is the cleanest-burning fossil fuel, emitting half the pollutants of coal. Given the current political and economic climate, there is much incentive for increased use of natural gas as the “bridge fuel.” Electric Power Consumption in trillion Btu CO2 Emissions - Electric Power in millions of metric tons 22% 11% Renewables 22% Nuclear 18% Nat Gas 1% Petroleum Coal 48% The EIA’s Annual Energy Outlook predicts that by the year 2035, coal will still comprise 22% of U.S. energy consumption while renewables grow from 7 to 11%. Sources: EIA May 2010 Monthly Energy Review, Annual Energy Outlook 2010