Download
1 / 1
30 likes | 160 Views
Lidar-Based Slope Models as a Guide for Geomorphic Mapping: A Case Study in the Upper Nehalem Watershed, Oregon Riccilee Keller, Earth Science Major, Western Oregon University Faculty Mentor: Dr. Stephen Taylor, Ph.D. ABSTRACT. MAP PRODUCTS. METHODS & RESULTS.

E N D
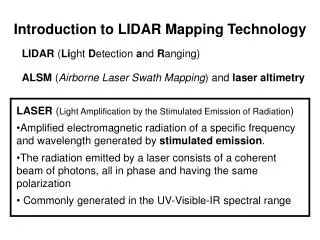
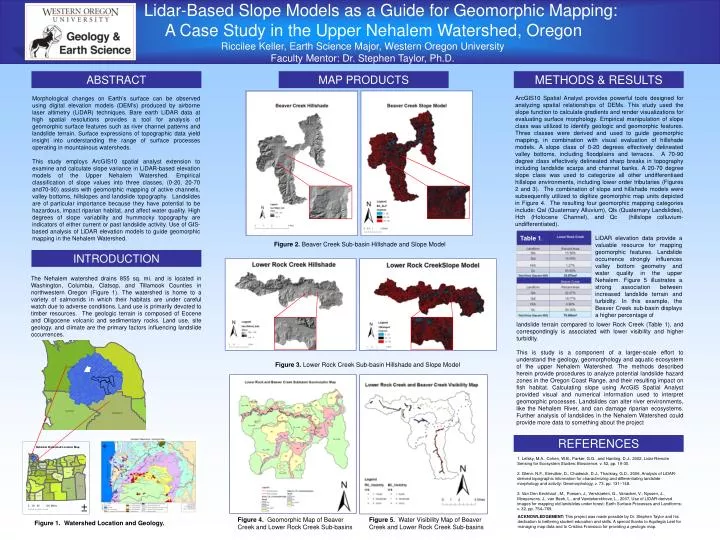
Lidar-Based Slope Models as a Guide for Geomorphic Mapping: A Case Study in the Upper Nehalem Watershed, Oregon Riccilee Keller, Earth Science Major, Western Oregon University Faculty Mentor: Dr. Stephen Taylor, Ph.D. ABSTRACT MAP PRODUCTS METHODS & RESULTS Morphological changes on Earth’s surface can be observed using digital elevation models (DEM’s) produced by airborne laser altimetry (LiDAR) techniques. Bare earth LiDAR data at high spatial resolutions provides a tool for analysis of geomorphic surface features such as river channel patterns and landslide terrain. Surface expressions of topographic data yield insight into understanding the range of surface processes operating in mountainous watersheds. This study employs ArcGIS10 spatial analyst extension to examine and calculate slope variance in LiDAR-based elevation models of the Upper Nehalem Watershed. Empirical classification of slope values into three classes, (0-20, 20-70 and70-90) assists with geomorphic mapping of active channels, valley bottoms, hillslopes and landslide topography. Landslides are of particular importance because they have potential to be hazardous, impact riparian habitat, and affect water quality. High degrees of slope variability and hummocky topography are indicators of either current or past landslide activity. Use of GIS-based analysis of LiDAR elevation models to guide geomorphic mapping in the Nehalem Watershed. ArcGIS10 Spatial Analyst provides powerful tools designed for analyzing spatial relationships of DEMs. This study used the slope function to calculate gradients and render visualizations for evaluating surface morphology. Empirical manipulation of slope class was utilized to identify geologic and geomorphic features. Three classes were derived and used to guide geomorphic mapping, in combination with visual evaluation of hillshade models. A slope class of 0-20 degrees effectively delineated valley bottoms, including floodplains and terraces. A 70-90 degree class effectively delineated sharp breaks in topography including landslide scarps and channel banks. A 20-70 degree slope class was used to categorize all other undifferentiaed hillslope environments, including lower order tributaries (Figures 2 and 3). The combination of slope and hillshade models were subsequently utilized to digitize geomorphic map units depicted in Figure 4. The resulting four geomorphic mapping categories include: Qal (Quaternary Alluvium), Qls (Quaternary Landslides), Hch (Holocene Channel), and Qc (hillslope colluvium-undifferentiated). Table 1. LiDAR elevation data provide a valuable resource for mapping geomorphic features. Landslide occurrence strongly influences valley bottom geometry and water quality in the upper Nehalem. Figure 5 illustrates a strong association between increased landslide terrain and turbidity. In this example, the Beaver Creek sub-basin displays a higher percentage of Figure 2. Beaver Creek Sub-basin Hillshade and Slope Model INTRODUCTION The Nehalem watershed drains 855 sq. mi. and is located in Washington, Columbia, Clatsop, and Tillamook Counties in northwestern Oregon (Figure 1). The watershed is home to a variety of salmonids in which their habitats are under careful watch due to adverse conditions. Land use is primarily devoted to timber resources. The geologic terrain is composed of Eocene and Oligocene volcanic and sedimentary rocks. Land use, site geology, and climate are the primary factors influencing landslide occurrences. landslide terrain compared to lower Rock Creek (Table 1), and correspondingly is associated with lower visibility and higher turbidity. This is study is a component of a larger-scale effort to understand the geology, geomorphology and aquatic ecosystem of the upper Nehalem Watershed. The methods described herein provide procedures to analyze potential landslide hazard zones in the Oregon Coast Range, and their resulting impact on fish habitat. Calculating slope using ArcGIS Spatial Analyst provided visual and numerical information used to interpret geomorphic processes. Landslides can alter river environments, like the Nehalem River, and can damage riparian ecosystems. Further analysis of landslides in the Nehalem Watershed could provide more data to something about the project Figure 3. Lower Rock Creek Sub-basin Hillshade and Slope Model REFERENCES 1. Lefsky, M.A., Cohen, W.B., Parker, G.G., and Harding, D.J., 2002, Lidar Remote Sensing for Ecosystem Studies: Bioscience, v. 52, pp. 19-30. 2. Glenn, N.F., Streutker, D., Chadwick, D.J., Thackray, G.D., 2006, Analysis of LiDAR-derived topographic information for characterizing and differentiating landslide morphology and activity: Geomorphology, v. 73, pp. 131–148. 3. Van Den Eeckhaut , M., Poesen, J., Verstraeten, G., Vanacker, V., Nyssen, J., Moeyersons, J., van Beek, L., and Vandekerckhove, L., 2007, Use of LIDAR-derived images for mapping old landslides under forest: Earth Surface Processes and Landforms; v. 32, pp. 754–769. ACKNOWLEDGEMENT: This project was made possible by Dr. Stephen Taylor and his dedication to bettering student education and skills. A special thanks to Aquilegia Leet for managing map data and to Cristina Fransisco for providing a geologic map. Figure 4. Geomorphic Map of Beaver Creek and Lower Rock Creek Sub-basins Figure 5. Water Visibility Map of Beaver Creek and Lower Rock Creek Sub-basins Figure 1. Watershed Location and Geology.