Download
1 / 1
10 likes | 123 Views
US and Hispanic Farm Sales (including Gov’t Payments). Max. Value of Sales. Number of Farms. Percentage. US. Hispanic. US. Hispanic. $ 1,000. 195,344. 4,610. 10%. 17%. $ 2,500. 237,793. 4,158. 12%. 15%. $ 5,000.

E N D
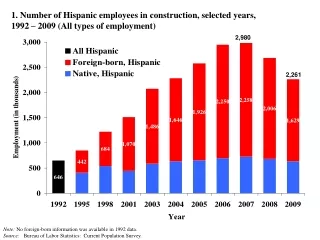
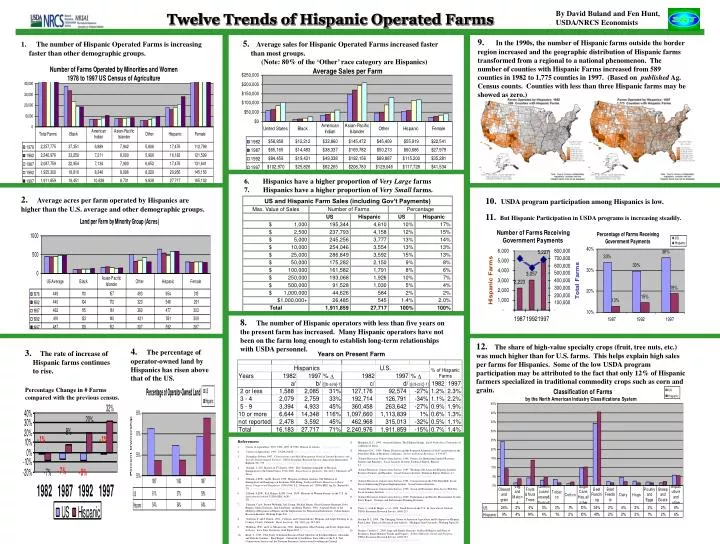
US and Hispanic Farm Sales (including Gov’t Payments) Max. Value of Sales Number of Farms Percentage US Hispanic US Hispanic $ 1,000 195,344 4,610 10% 17% $ 2,500 237,793 4,158 12% 15% $ 5,000 245,256 3,777 13% 14% $ 10,000 254,046 3,554 13% 13% $ 25,000 286,849 3,592 15% 13% $ 50,000 175,282 2,150 9% 8% $ 100,000 161,582 1,791 8% 6% $ 250,000 193,068 1,926 10% 7% $ 500,000 91,528 1,030 5% 4% $ 1,000,000 44,626 584 2% 2% $1,000,000+ 26,485 545 1.4% 2.0% Total 1,911,859 27,717 100% 100% ByDavid Buland and Fen Hunt,USDA/NRCS Economists Twelve Trends of Hispanic Operated Farms . 9. In the 1990s, the number of Hispanic farms outside the border region increased and the geographic distribution of Hispanic farms transformed from a regional to a national phenomenon. The number of counties with Hispanic Farms increased from 589 counties in 1982 to 1,775 counties in 1997. (Based on published Ag. Census counts. Counties with less than three Hispanic farms may be showed as zero.) 1. The number of Hispanic Operated Farms is increasing faster than other demographic groups. 5. Average sales for Hispanic Operated Farms increased faster than most groups. (Note: 80% of the ‘Other’ race category are Hispanics) • Hispanics have a higher proportion of Very Large farms • . Hispanics have a higher proportion of Very Small farms. 2. Average acres per farm operated by Hispanics are higher than the U.S. average and other demographic groups. 10. USDA program participation among Hispanics is low. 11. But Hispanic Participation in USDA programs is increasing steadily. 8. The number of Hispanic operators with less than five years on the present farm has increased. Many Hispanic operators have not been on the farm long enough to establish long-term relationships with USDA personnel. 12. The share of high-value specialty crops (fruit, tree nuts, etc.) was much higher than for U.S. farms. This helps explain high sales per farms for Hispanics. Some of the low USDA program participation may be attributed to the fact that only 12% of Hispanic farmers specialized in traditional commodity crops such as corn and grain. 4. The percentage of operator-owned land by Hispanics has risen above that of the US. 3. The rate of increase of Hispanic farms continues to rise. Years on Present Farm Percentage Change in # Farms compared with the previous census. • References: • Census of Agriculture, 1978, 1982, 1987, & 1992. Bureau of Census, www.census.gov • Census of Agriculture, 1997. USDA-NASS. http://www.nass.usda.gov/census/ • Dismukes, Robert, 1997. Characteristics and Risk Management Needs of Limited-Resource and Socially Disadvantaged Farmers. USDA-Economic Research Service, Agriculture Information Bulletin, No. 733. www.ers.usda.gov/epubs/pdf/aib733/index.htm • Durand, J., D.S. Massey, & F. Charvet, 2000. The Changing Geography of Mexican Immigration to the United States: 1910-1996. Social Science Quarterly, Vol. 81(1), University of Texas. • Effland, A.B.W., and K. Kassel, 1998. Hispanics in Rural America: The Influence of Immigration and Language on Economic Well-Being. In Racial/Ethnic Minorities in Rural Areas: Progress and Stagnation, 1980-1990, L.L. Swanson, ed., USDA-ERS, Ag. Ec. Report No. 731. www.ers.usda.gov/epubs/pdf/aer731/AER731h.PDF • Effland, A.B.W., R.A. Hoppe, & P.R. Cook, 1998. Minority & Women Farmers in the U.S. In Agricultural Outlook, USDA-ERS, AGO-251www.ers.usda.gov/epubs/pdf/agout/may98/ao251d.pdf • Fimmen, Carol, Burton Witthuhn, Jeff Crump, Michael Brunn, Gloria Delaney-Barmann, Debi Riggins, Maria Gutierrez, Dan Schabilion, and Britta Watters, 1998. A Spatial Study of the Mobility of Hispanics in Illinois and the Implications for Educational Institutions. Julian Samora Research Institute, Working Paper #43. http://www.jsri.msu.edu/RandS/research/wps/wp43.pdf • Gutierrez P. and J. Eckert, 1991. Contrasts and Commonalities: Hispanic and Anglo Farming in Conejos County, Colorado. Rural Sociology, Vol. 56(2), pp. 247-263. • Huffman, W.E., and J.A. Miranowski, 1996. Immigration, Meat Packing, and Trade: Implication for Iowa. Iowa State University, Staff Paper #285. http://agecon.lib.umn.edu/isu/isu285.pdf • Kraft, S., 1993. Pilot Study of Limited Resource Farm Operators in Southern Illinois: Alexander and Pulaski Counties – Final Report. Submitted to the Illinois State Office of the U.S. Soil Conservation Service and the Shawnee Resource Conservation Development Council. • Mountjoy, D.C., 1995. Outreach Efforts: The Elkhorn Slough. Small Farm News, University of California at Davis. • Mountjoy D.C., 1996. Ethnic Diversity and the Patterned Adoption of Soil Conservation in the Strawberry Hills of Monterey, California. Society & Natural Resources, 9:339-357. • Natural Resources Conservation Service, 1996. Process for Identifying Limited Resource Farmers and Ranchers. Social Sciences Institute, Technical Report, Release 2.1. http://people.nrcs.wisc.edu/SocSciInstitute/limitedframe.htm • Natural Resources Conservation Service, 1997. Working with Asian and Hispanic Limited Resource Farmers and Ranchers. Social Sciences Institute, Technical Report, Release 4.1. http://people.nrcs.wisc.edu/SocSciInstitute/working_with_frames.htm • Natural Resources Conservation Service, 1998. Conservation in the 1996 Farm Bill: Social Factors Influencing Program Implementation. Social Sciences Institute. • Natural Resources Conservation Service, 1999. Social and Economic Data Access Web Site. Social Sciences Institute. http://people.nrcs.wisc.edu/SocSciInstitute/socanthrSoftData.htm • Natural Resources Conservation Service, 2000. Performance and Results Measurement System Parity Report. Strategic and Performance Planning Division. http://calais.itc.nrcs.usda.gov/prmsproducts • Perry, J., with B. Hoppe, et. al., 1998. Small Farms in the U.S. In Agricultural Outlook, USDA-Economic Research Service, AGO-251. http://www.ers.usda.gov/epubs/pdf/agout/may98/ao251e.pdf • Rochin, R.I., 1989. The Changing Nature of American Agriculture and Its Impact on Hispanic Farm Labor: Topics for Research and Analysis. Michigan State University, Working Paper No. 3. http://www.jsri.msu.edu/RandS/research/wps/wp03abs.html • Rogers, Carolyn C., 2000. Aege and Family Structure, by Race/Ethnicity and Place of Residence, Rural Minority Trends and Progress. In Rural Minority Trends and Progress, USDA-Economic Research Service, AGO-731. http://www.ers.usda.gov/epubs/pdf/aer731/AER731d.PDF