Download
1 / 25
250 likes | 313 Views
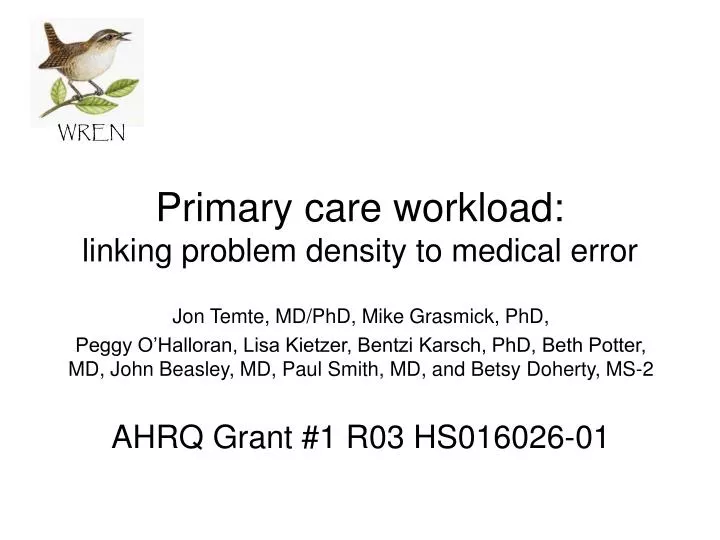
Primary care workload: linking problem density to medical error. WREN. Jon Temte, MD/PhD, Mike Grasmick, PhD, Peggy O’Halloran, Lisa Kietzer, Bentzi Karsch, PhD, Beth Potter, MD, John Beasley, MD, Paul Smith, MD, and Betsy Doherty, MS-2 AHRQ Grant #1 R03 HS016026-01. Study in a Nutshell.

E N D
Primary care workload:linking problem density to medical error WREN Jon Temte, MD/PhD, Mike Grasmick, PhD, Peggy O’Halloran, Lisa Kietzer, Bentzi Karsch, PhD, Beth Potter, MD, John Beasley, MD, Paul Smith, MD, and Betsy Doherty, MS-2 AHRQ Grant #1 R03 HS016026-01
Study in a Nutshell • This AHRQ-funded WREN study • examine 600 clinical encounters • conducted by 30 clinicians • to assess interactions of problem number, MWL and error • Data collection completed with 31 clinician and 615 visits • Relationships between clinician MWL and patient age and sex, continuity status, number of problems per encounter (NPPE) and perceived medical error (PME) were assessed using ANOVA and correlation analyses. • Analysis of covariance used to assess potential differences among the 31 clinicians.
Basic Study Demographics • Four Primary Care Clinics affiliated with WREN • 2 urban and 2 rural • Multiple clinicians (Goal = 30) • Mix of FPs, IMs, MDs, PAs, and NPs • Quasi-randomly selected patients • 6 random time periods per day • Age > 18, mentally competent • Current Patient Demographics • Mean age = 54.6 +/- 17.5 years • 63.5% female
Social support Experience Mediators Immediate outcomes Long-term outcomes Individualfactors Affect Poor Communication Memorycapacity Provider- Stress- Errors- Delays Provider- Disease- Burnout- Lowquality Number ofproblems Fatigue Mentaldemands MWL Complexity Demands Emotionaldemands x More slips Patient- Stress- Harm- Dissatis-faction Patient-Stress- Poorhealth- Reducedtrust Temporaldemands Difficulty ofproblems Baddecisions Workschedule Worksystemfactors Socialenvironment Supporttechnology Control factors Affect Decisionauthority Perceived Locusof control Copingstrategies Supporttechnology Rest breaks Notes1.The above components are merely examples. Clearly, others may be added and this is all amenable to modification.2.This model, despite its many components, is probably a simplification of the true nature of mental workload. However, this model (or something like it) can serve as a conceptual base camp from which studies are launched. The boxes with shaded backgrounds represent variables that can potentially be measured—albeit not all in the initial study. However, I would make the case that many of them can be measured with minimal intrusion and time demand on the docs. Some, like experience, memory capacity, social support, coping strategies, etc. can be measured only once or can be obtained without any effort from the doc (RICHARD JOHN HOLDEN, 2005; rholden@students.wisc.edu).
Patient arrives at clinic DE#1 Demographic data (age, sex) Patient’s anticipated number of concerns DE#2 Clinician’s reported number of problems (NPPE) Patient placed in exam room by medical assistant Informed consent DE#3 Clinician’s mental workload (NASA TLX) Clinician evaluates and manages patient and problems DE#4 Clinician’s estimate of likelihood of error DE#5 Time spent in direct patient contact Medical assistant exits patient Clinician dictates and photocopies clinical note DE#6 Audit of note for quality measures DE#7 Patient’s satisfaction, assessment of level to which concerns were addressed during visit and estimate of error
Results • Measures of Problem Density • Number of problems per encounter • Measures of Mental Workload • Mean • Variation • Range • Estimates of Completeness and Error
Encounter Problem Density • Number of Problems per Encounter • Mean = 3.30 +/- 1.96 (sd) • Range: [1 – 12] • Significant differences among clinicians • ANOVA: P<0.001 • Number of Problems per Scheduled Time • Mean = 10.39 +/- 6.89 (sd) problems per hour • Range: [2.0 – 42.0] • Significant differences among clinicians • ANOVA: P<0.001
Managing Multiple and Potentially Competing Problems(current study; n = 609 visits) Mean = 3.30 Std. Dev. = 1.96
Effect of Patient Age onNumber of Problem per Encounter r = 0.237 P < 0.001
Mental Workload in Primary Care(n = 598; mean = 47.6 + 18.4)
Mental Workload in Primary Care Composite NASA-TLX • n = 598 • Range: [5.00 to 95.3] • Mean = 47.6 • Std dev = 18.4 Individual Variation • N = 31 clinicians • ANOVA: P<0.001 Clinician Average
Effect of Patient Age on Workload r = 0.152 P < 0.001
Effect of Patient Sex, Continuity Status, and Presenting Problem on Workload
MWL is Related to Complexity (TLX = 36.3 + 3.45*NPPE; r2 = 0.134)
Emergent Themes for Outlier Analysis of Clinical Visits with Lower and Higher than Expected Work Load
Distribution of Perceived Medical Error • Mean = 6.9 +/- 2.2 (sd) → relatively low • Range: [3 – 16] → moderate variation • Significant differences among clinicians • ANOVA: P<0.001
Medical Error is related MWL (PME = 5.64 + 0.026*TLX; r2 = 0.044)
Conclusion • Primary care encounters are complex • Mean of 3.3 problems per visit • Visits are associated with moderately high workloads with a tremendous range • Workload is associated with • Complexity and type of visit • Patient, clinician and workplace factors • Relationships • Errors is associated with level of workload • Some components are not modifiable • Time factors and frustration can be modified