Download
1 / 12
120 likes | 126 Views
Plotting mathematical functions. Scenario. Domain. We need to know the desired starting and ending values of the variable. Our variable is r the distance between the atoms, and we will start by looking at the function starting at r=0.2 and ending at r=1.0 (nanometers).

E N D
Plotting mathematical functions CSC 152
Scenario CSC 152
Domain • We need to know the desired starting and ending values of the variable. Our variable is r the distance between the atoms, and we will start by looking at the function starting at r=0.2 and ending at r=1.0 (nanometers). • Next we must decide on the intermediate values between 0.2 and 1.0. Let us go up by 0.001’s. CSC 152
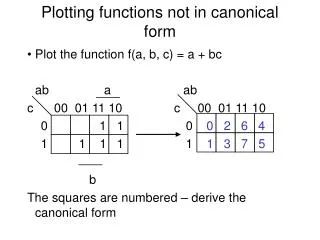
Make a place for the parameters at the top, start the set of r values at 0.2 and enter a formula like =A6+0.001. Copy that down until you get to the desired ending value CSC 152
Enter the formula for the potential, something like =4*B$2*((B$3/A6)^12-(B$3/A6)^6). Note the use of absolute addressing (dollar signs) with the parameters. CSC 152
Make an XY Scatter Graph of the data and also find its minimum CSC 152
Scale the y axis to vary from -1 to 2. Scale the x axis to vary from 0 to 1. CSC 152
Create columns for the average consecutive r value =AVERAGE(A6:A7) and the Approximate derivative = (B7-B6)/(A7-A6) (Note it’s rise over run.) CSC 152
Here we are just testing an idea from calculus that the minimum occurs where the derivative changes sign (is zero) CSC 152
Change the ε parameter controls the depth of the “well” CSC 152
The σ parameter controls the r-value at which the minimum occurs CSC 152
References • http://polymer.bu.edu/Wasser/robert/work/node8.html CSC 152