Download
1 / 20
200 likes | 202 Views
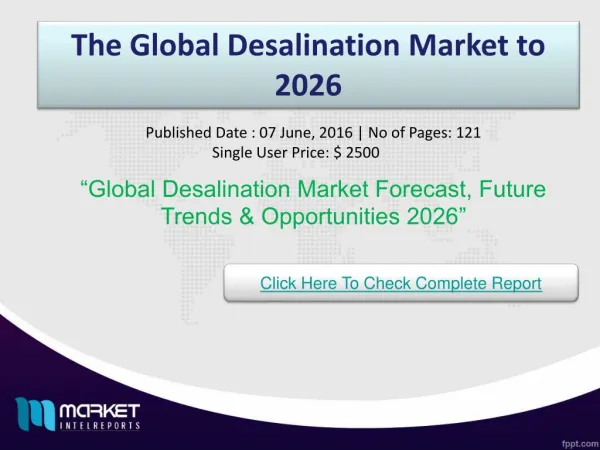
The global foodservice market was valued at USD3093.96 billion in 2020, but it is projected to rise at a CAGR of over 4.72 percent in the coming years, to reach USD3978.83 billion by the end of 2026. Click : https://bit.ly/3y3a8NS

E N D
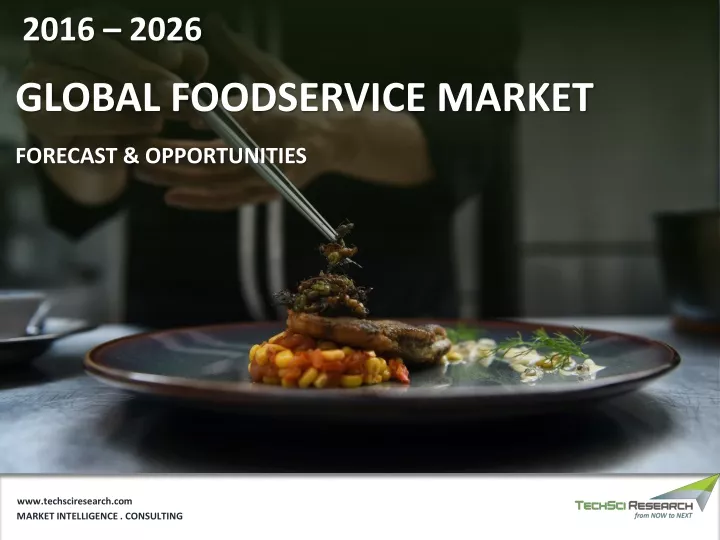
2016 – 2026 GLOBAL FOODSERVICE MARKET FORECAST & OPPORTUNITIES www.techsciresearch.com MARKET INTELLIGENCE . CONSULTING
Scope of Report Product of Interest (POI): Foodservice Food service or catering industry defines those businesses, institutions, and companies responsible for any meal prepared outside the home. This industry includes restaurants, school and hospital cafeterias, catering operations, and many other formats. Market Segmentation REGION TYPE Year Range Europe • Dining Service • North America • QSR • Review Period South America • PBCL • 2016 – 2019 Middle East & Africa • Others • Asia Pacific • Base Year OWNERSHIP 2020 Independent Outlets • Estimated Year Chained Outlets • 2021 Forecast Period 2022 – 2026 2
Table of Contents S. No. Contents Page No. 1. Product Overview 2. Research Methodology 3. Executive Summary 4. Voice of Customer 4.1. Factors Affecting Purchase Decision 4.2. Brand Awareness 4.3. Challenges Post Purchase 4.4. Preferred Distribution Channel 5. Global Foodservice Market Outlook, 2016-2026F Market Size & Forecast 5.1. 5.1.1. By Value 5.2. Market Share & Forecast By Type (Dining Service, QSR (Quick Service Restaurants), PBCL (Pubs, Bars, Cafe and Lounges), and Others) 5.2.2. By Ownership (Independent Outlets vs. Chained Outlets) 5.2.1. 5.2.5. By Region 5.2.6. By Company (2020) Market Map 5.3. 6. Asia-Pacific Foodservice Market Outlook, 2016-2026F Market Size & Forecast 6.1. 6.1.1. By Value 6.2. Market Share & Forecast 3
Table of Contents S. No. Contents Page No. 6.2.1. By Type 6.2.2. By Ownership 6.2.3. By Country 6.3. Asia Pacific: Country Analysis 6.3.1. China Foodservice Market Outlook, 2016-2026F 6.3.1.1. Market Size & Forecast 6.3.1.1.1. By Value 6.3.1.2. Market Share & Forecast 6.3.1.2.1. By Type 6.3.1.2.2. By Ownership 6.3.2. India Foodservice Market Outlook, 2016-2026F 6.3.2.1. Market Size & Forecast 6.3.2.1.1. By Value 6.3.2.2. Market Share & Forecast 6.3.2.2.1. By Type 6.3.2.2.2. By Ownership 6.3.3. Japan Foodservice Market Outlook, 2016-2026F 6.3.3.1. Market Size & Forecast 6.3.3.1.1. By Value 6.3.3.2. Market Share & Forecast 6.3.3.2.1. By Type 4
Table of Contents S. No. Contents Page No. 6.3.3.2.2. By Ownership 6.3.4. South Korea Foodservice Market Outlook, 2016-2026F 6.3.4.1. Market Size & Forecast 6.3.4.1.1. By Value 6.3.4.2. Market Share & Forecast 6.3.4.2.1. By Type 6.3.4.2.2. By Ownership 6.3.5. Australia Foodservice Market Outlook, 2016-2026F 6.3.5.1. Market Size & Forecast 6.3.5.1.1. By Value 6.3.5.2. Market Share & Forecast 6.3.5.2.1. By Type 6.3.5.2.2. By Ownership 7. Europe Foodservice Market Outlook, 2016-2026F Market Size & Forecast 7.1. 7.1.1. By Value 7.2. Market Share & Forecast By Type 7.2.1. By Ownership 7.2.2 7.2.3. By Country 5
Table of Contents S. No. Contents Page No. 7.3. Europe: Country Analysis 7.3.1. France Foodservice Market Outlook, 2016-2026F 7.3.1.1. Market Size & Forecast 7.3.1.1.1. By Value 7.3.1.2. Market Share & Forecast 7.3.1.2.1. By Type 7.3.1.2.2. By Ownership 7.3.2. United Kingdom Foodservice Market Outlook, 2016-2026F 7.3.2.1. Market Size & Forecast 7.3.2.1.1. By Value 7.3.2.2. Market Share & Forecast 7.3.2.2.1. By Type 7.3.2.2.2. By Ownership 7.3.3. Italy Foodservice Market Outlook, 2016-2026F 7.3.3.1. Market Size & Forecast 7.3.3.1.1. By Value 7.3.3.2. Market Share & Forecast 7.3.3.2.1. By Type 7.3.3.2.2. By Ownership 7.3.4. Germany Foodservice Market Outlook, 2016-2026F 7.3.4.1. Market Size & Forecast 7.3.4.1.1. By Value 7.3.4.2. Market Share & Forecast 6
Table of Contents S. No. Contents Page No. 7.4.4.2.1. By Type 7.4.4.2.2. By Ownership 7.3.5. Russia Foodservice Market Outlook, 2016-2026F 7.3.5.1. Market Size & Forecast 7.3.5.1.1. By Value 7.3.5.2. Market Share & Forecast 7.3.5.2.1. By Type 7.3.5.2.2. By Ownership 8. North America Foodservice Market Outlook, 2016-2026F Market Size & Forecast 8.1. 8.1.1. By Value 8.2. Market Share & Forecast 8.2.1. By Type 8.2.2 By Ownership 8.2.3. By Country 8.3. North America: Country Analysis 8.3.1. United States Foodservice Market Outlook, 2016-2026F 8.3.1.1. Market Size & Forecast 8.3.1.1.1. By Value 8.3.2.2. Market Share & Forecast 8.3.1.2.1. By Type 8.3.1.2.2. By Ownership 7
Table of Contents S. No. Contents Page No. 8.3.2. Mexico Foodservice Market Outlook, 2016-2026F 8.3.2.1. Market Size & Forecast 8.3.2.1.1. By Value 8.3.2.2. Market Share & Forecast 8.3.2.2.1. By Type 8.3.2.2.2. By Ownership 8.3.3. Canada Foodservice Market Outlook, 2016-2026F 8.3.3.1. Market Size & Forecast 8.3.3.1.1. By Value 8.3.3.2. Market Share & Forecast 8.3.3.2.1. By Type 8.3.3.2.2. By Ownership 9. South America Foodservice Market Outlook, 2016-2026F Market Size & Forecast 9.1. 9.1.1. By Value 9.2. Market Share & Forecast 9.2.1. By Type 9.2.2 By Ownership 9.2.3. By Company 9.2.4. By Country 9.3. South America: Country Analysis 9.3.1. Brazil Foodservice Market Outlook, 2016-2026F 9.3.1.1. Market Size & Forecast 8
Table of Contents S. No. Contents Page No. 9.3.1.1.1. By Value 9.3.2.2. Market Share & Forecast 9.3.1.2.1. By Type 9.3.1.2.2. By Ownership 9.4.2. Argentina Foodservice Market Outlook, 2016-2026F 9.4.2.1. Market Size & Forecast 9.4.2.1.1. By Value 9.4.2.2. Market Share & Forecast 9.4.2.2.1. By Type 9.4.2.2.2. By Ownership 9.4.3. Colombia Foodservice Market Outlook, 2016-2026F 9.4.3.1. Market Size & Forecast 9.4.3.1.1. By Value 9.4.3.2. Market Share & Forecast 9.4.3.2.1. By Type 9.4.3.2.2. By Ownership 10. Middle East and Africa Foodservice Market Outlook, 2016-2026F Market Size & Forecast 10.1. 10.1.1. By Value 10.2. Market Share & Forecast 10.2.1. By Type 10.2.2 By Ownership 9
Table of Contents S. No. Contents Page No. 10.2.3. By Country 10.3. MEA: Country Analysis 10.3.1. South Africa Foodservice Market Outlook, 2016-2026F Market Size & Forecast 10.3.1.1. 10.3.1.1.1. By Value Market Share & Forecast 10.3.2.2. 10.3.2.2.1. By Type 10.3.2.2.2. By Ownership 10.3.2. Saudi Arabia Foodservice Market Outlook, 2016-2026F Market Size & Forecast 10.3.2.1. 10.3.2.1.1. By Value Market Share & Forecast 10.3.2.2. 10.3.2.2.1. By Type 10.3.2.2.2. By Ownership 10.3.3. UAE Foodservice Market Outlook, 2016-2026F Market Size & Forecast 10.3.3.1. 10.3.3.1.1. By Value Market Share & Forecast 10.3.3.2. 10.3.3.2.1. By Type 10.3.3.2.2. By Ownership 10
Table of Contents S. No. Contents Page No. 10.3.4. Qatar Foodservice Market Outlook, 2016-2026F Market Size & Forecast 10.3.4.1. 10.3.4.1.1. By Value Market Share & Forecast 10.3.4.2. 10.3.4.2.1. By Type 10.3.4.2.2. By Ownership 11. Market Dynamics 11.1. Drivers 11.2. Challenges 12. Market Trends & Developments 13. Impact of COVID-19 on Global Foodservice Market 14. Competitive Landscape 14.1. Competition Outlook 14.2. Company Profiles (Top 10) 14.2.1. Company details 14.2.2. Financials (As Reported) 14.2.3. Product & Services 14.2.4. Key market focus and geographical presence 14.2.5. Expansion Strategies 14.2.6. Key Management Personnel 15. Strategic Recommendations 16. About us & Disclaimer 11
RESEARCH RESEARCH METHODOLOGY METHODOLOGY
Research Methodology Market Profiling Data Analysis Data Data Developing List of Respondents Formulating Questionnaire Collection Validation In-depth secondary research was conducted to determine top players in the global foodservice market, overall market size and segmental market size. The data was scrutinized using MS-Excel, statistical tools and internal proprietary database to obtain qualitative and quantitative insights about the global foodservice market. Data obtained as a result of primary and secondary research was validated through rigorous triangulation. TechSci conducted interviews with industry experts and industry players for data collection and verification. In order to conduct industry experts’ interviews, TechSci formulated a detailed discussion guide. List of industry players and industry specialists was developed. Primary Research Desk Research Company Analysis ✓ ✓ Recent Developments Market Changing Aspects/Dynamics Government Policies Conclusion ✓ ✓ Market Participants Key Strengths ✓ Identifying Key Opinion Leaders Questionnaire Design ✓ In-depth Interviews Actionable Insights Data Filter & Analysis Business Solution Research & Intelligence Data Collection ✓ ✓ ✓ Primary Research Secondary Research Paid Sources LinkedIn TechSci Internal Database Company Websites Company Annual Reports White Paper Study Financial Reports Investor Presentations Regulatory Body Associations, etc. Factiva Hoovers ✓ ✓ ✓ ✓ ✓ ✓ ✓ ✓ ✓ ✓ ✓ 13
Research Methodology Baseline Methodology Our dedicated team of industry experts has monitored and analyzed various aspects of the global foodservice market. The team has analyzed the outlook of various segments of this market, while considering the major influencing factors such as continuous change in consumer tastes, increasing innovation in existing products, rapid urbanization. The study includes market forecasting, which would enable our clients to take better decisions while planning their strategy to achieve sustainability in the global foodservice market. Methodology Followed for Calculation of Market Size: Market Size by Value & Volume : Market size, in terms of value, for the year 2020 was calculated based on information collected through • exhaustive secondary research and primary surveys, with various key opinion leaders/stakeholders, such as foodservice companies, channel partners, market influencers & end users, industry experts, and other industry participants. The team interviewed more than 15 – 20 foodservice companies, 100 – 120 end users, and 15 – 20 industry experts and other value chain • stakeholders in the global foodservice market to obtain the overall market size from 2016 to 2020, which was validated by the Delphi technique. Taking standard deviation into consideration, the market size was averaged out, to arrive at the market size data during 2016- 2020. 14
Research Methodology Respondents were asked about the current and future market growth rates, market shares by type, by ownership, by company and by each • region. Removing the outlier responses, the geometric mean of growth estimates and provider wise revenue shares generated across various segments were considered, to arrive at the final revenue shares. Revenue shares generated across various type were further triangulated from other stakeholders. Methodology Followed for Calculation of Market Shares: Market shares by type, by ownership, by company and by each region were calculated based on the responses received through primary • surveys with industry experts, in which the respondents were asked about the market shares or revenue generated from various types of foodservice. The final shares were calculated by taking the geometric mean of the responses gathered from key opinion leaders after eliminating the outliers. Methodology Followed for Forecasting: TechSci Research performed periodical checks on data collected through the surveys with logic checks and analyzed the survey results in • SPSS/Tableau Software. Data triangulation techniques were applied to fill the gaps and to present a more meaningful picture of the market. To forecast global • foodservice market, TechSci Research used various forecast techniques such as: Moving Average ✓ Time Series Analysis ✓ Regression Analysis ✓ Econometric and Judgmental Analysis ✓ 15
Research Methodology TechSci Research used its own forecast tool, which is based on the growth of various allied industries in respective regions. TechSci Research also used the impact analysis during short, medium and long term period to estimate the demand and to reach accurate market numbers. It should be noted that the figures compiled are only for the organized market including market share data. The currency used in the report is the United States Dollar (USD), with the market size indicated in USD million. Partial List of Companies Interviewed Key Secondary Sources Compass Group PLC McDonald's Corporation Performance Food Group Company Sodexo Group Aramark Corporation Restaurant Brands International Inc. Yum! Brands, Inc. Autogrill S.p.A. Domino's Pizza, Inc. Starbucks Corporation World Bank International Monetary Fund (IMF) TechSci Research Proprietary Database & Knowledge Repository Company Annual Reports Industry Magazines Industry Reports News Dailies Credible Paid Databases ▪ ▪ ▪ ▪ ▪ ▪ ▪ ▪ ▪ ▪ ▪ ▪ ▪ ▪ ▪ ▪ ▪ ▪ 16
Industry Brief According to TechSci Research report, “Global Foodservice Market By Type (Dining Service (Hotels, Restaurants), QSR (Quick Service Restaurants), PBCL (Pubs, Bars, Cafe and Lounges), and Others), By Ownership (Independent Outlets vs. Chained Outlets), By Region, Competition, Forecast & Opportunities, 2026”, the global foodservice market is anticipated to grow from USD3093.96 billion in 2020 to USD3978.83 billion in 2026 at a CAGR of 4.72%. The growth is expected as the companies are rearranging their operations to recover the loss that occurred because of COVID-19, which led to the tentative shutdown of commercial activities to maintain the social distancing which resulted in operational challenges and a huge loss to the foodservice industry. However, it is expected that the foodservice market will recover from the loss across the forecast period as it is an unpredicted event, and it could not be defined through the ongoing weakness in the foodservice market or the global economy. As the trend for socializing in cafes is increasing among the urban millennials and it is majorly the youngest population which is driving the growth of the chained foodservice market at a much faster pace. Also, the rapid increase in infrastructural development like airports, metro services, hospital facilities, malls, and expressways in emerging countries has given hopes to various chained outlets to increase their market share. Consequently, the growing trend for fast-food and ready to eat items has caused an immense boost to the chained foodservice market. Moreover, the launch of low-fat drinks, gluten-free products, on-the-go foodservice and online platforms, as well as attractive packaging, are all contributing to the market's development. Even the factors such as the increasing number of working women, decline in the practice of preparing homemade food, increasing disposable income, improving distribution channels, etc. are also catalyzing the growth of the foodservice market. The foodservice market deals with both internal as well as external factors to meet the expectations of the target audience, such factors are heavy chef rotations, green packaging and waste reduction, holistic dining experience, menu optimization, and cashless transactions and digitalization. Nowadays people are more demanding, not in just terms of taste of the food or cuisine but are also concerned about the décor, environment, efficiency of the service provider, cost optimization, consistency with the food taste, and the digital mode of transactions. Many restaurants have recently begun introducing modern technology like tablets on their tabletops to automate the process of ordering food. For example, Chili’s, an American casual dining restaurant chain overhauled its in-store ordering system by adding more than 45000 tablets across its 823 stores. Technology-driven solutions and facilities are becoming more popular in bars and nightclubs. Self-ordering touchscreen kiosks, smartphone applications for personalized orders and fast payment, and digital entertainment such as gaming are all being introduced by companies in the sector. It is the dining service restaurants, which is the most widespread foodservice model (contributing to the one-third of the food-service market). But it is expected that due to pertaining demand for the fast-food market, it will be the quick service restaurant (QSR) segment that is expected to grow at faster pace than the market of dining service restaurants in the upcoming future market. The largest market share of the foodservice industry will be dominated by the Asia-Pacific region in the forecast period. This can be attributed to the fact that this region holds the largest portion of the young and millennial population combined with the increase in the number of restaurants, a combination of different culture and cuisine. It is witnessed that there is an increasing preference and demand by the people to eat outside due to which value of services provided by the restaurants gets improvised. Compass Group PLC, McDonald's Corporation, Performance Food Group Company, Sodexo Group, Aramark Corporation, Restaurant Brands International Inc., Yum! Brands, Inc., Autogrill S.p.A., Domino's Pizza, Inc., and Starbucks Corporation are some of the leading players operating in the global foodservice market. Major foodservice companies are expanding their manufacturing bases to meet the rising demand across developing countries in North America, Europe, Asia-Pacific, Middle East & Africa, and South America. The global foodservice market is competitive with the presence and minimal market share of domestic companies in countries such as China and India. Above all other aspects, the launching of a new product has become the most critical strategy, due to the rapidly changing nature, taste, and preferences of the consumers. Also, businesses have embraced growth through mergers and acquisitions by multinational companies, which has proven to be successful in making their presence stronger. “The global foodservice market is anticipated to grow over 4.72% CAGR during the next five years due to growing consumer base and increasing disposable income. Moreover, technological up- gradation and growing demand for ready-to-eat foods are further anticipated to positively influence the growth of the market through 2026,” said Mr. Karan Chechi, Research Director with TechSci Research, a research-based global management consulting firm. 17
Sample Data - Snapshot Global Foodservice Market Size, By Value (USD Million), 2016–2026F 15.00 14.00 13.00 12.00 11.00 10.00 9.00 8.00 7.00 6.00 5.00 CAGR By Value XX% 2016 2020 2021E 2026F CAGR By Value YY% By Value (USD Million) Asia-Pacific Foodservice Market Share, By Type, By Value, 2016–2026F Dining Service QSR PBCL Others 30% 30% 30% 10% 2026F 30% 30% 30% 10% 2025F 30% 30% 30% 10% 2024F 30% 30% 30% 10% 2023F 30% 30% 30% 10% 2022F 30% 30% 30% 10% 2021E 30% 30% 30% 10% 2020 30% 30% 30% 10% 2019 30% 30% 30% 10% 2018 30% 30% 30% 10% 2017 30% 30% 30% 10% 2016 India Foodservice Market Share, By Ownership, By Value, 2016–2026F Independent Outlets Chained Outlets 40% 60% 2026F 40% 60% 2025F 40% 60% 2024F 40% 60% 2023F 40% 60% 2022F 40% 60% 2021E 40% 60% 2020 40% 60% 2019 40% 60% 2018 40% 60% 2017 40% 60% 2016 18
Report Ordering Report Name: GLOBAL FOODSERVICE MARKET FORECAST & OPPORTUNITIES 2016 – 2026 License Type Price Single User License $4450 Multi-User License $5450 Custom Research License $9450 To View Sample OR Purchase Report 19
About Us & Disclaimer TechSci Research is a global market research and consulting company with offices in the US, UK and India. TechSci Research provides market research reports in number of areas to organizations. The company uses innovative business models that focus on improving productivity, while ensuring creation of high-quality reports. The proprietary forecasting models use various analyses of both industry-specific and macroeconomic variables on a state-by-state basis to produce a unique ‘bottom-up’ model of a country, regional and global industry prospects. Combined with the detailed analysis of company activity and industry trends, the result is a uniquely rich evaluation of the opportunities available in the market. Related Reports Global Confectionery Market By Type (Chocolate, Sugar Candy & Gum Candy), By Distribution Channel (Supermarkets/Hypermarket, Independent Grocery Stores, Convenience Stores/Forecourt Retailers, Departmental Store, Non-Store Retailing (Online Store)), By Region, Competition Forecast & Opportunities, 2016-2026F. • Global Microwave Oven Market By Product (Convection, Grill and Solo), By Application (Household and Commercial), By Structure (Free- Standing and Built-in), By Region, Competition, Forecast & Opportunities, 2026F. • TechSci Research – North America 708 Third Avenue, Manhattan, New York, United States Tel: +1- 646- 360- 1656 Email: sales@techsciresearch.com www.techsciresearch.com TechSci Research – Europe 54, Old brook, Bretton, Peterborough, United Kingdom Email: sales@techsciresearch.com www.techsciresearch.com TechSci Research – Asia-Pacific B – 44, Sector – 57, Noida, National Capital Region, U.P. - India Tel: +91-120-4523900 Email: sales@techsciresearch.com www.techsciresearch.com Disclaimer The contents of this report are based on information generally available to the public from sources believed to be reliable. No representation is made that it is timely, accurate or complete. TechSci Research has taken due care and caution in compilation of data as this has been obtained from various sources including which it considers reliable and firsthand. However, TechSci Research does not guarantee the accuracy, adequacy or completeness of any information and it is not responsible for any errors or omissions or for the results obtained from the use of such information and especially states that it has no financial liability whatsoever to the subscribers / users of this report. The information herein, together with all estimates and forecasts, can change without notice. All the figures provided in this document are indicative of relative market size and are strictly for client’s internal consumption. Usage of the same for purpose other than internal will require prior approval of TechSci Research.