Download
1 / 18
210 likes | 593 Views
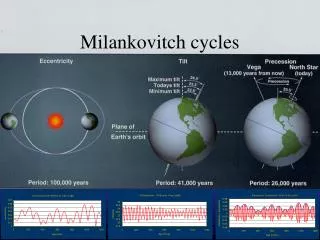
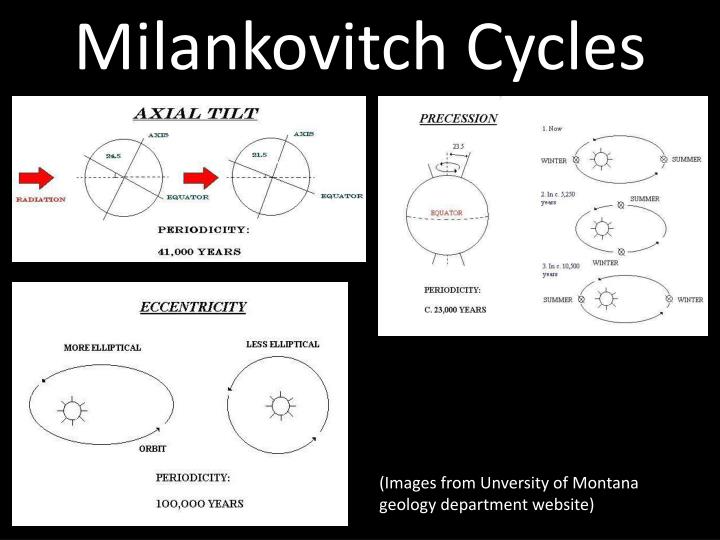
Milankovitch Cycles. (Images from Unversity of Montana geology department website). Vostok ice core record (from US global change research program website). Rate of Change of Ice Volume vs. Orbital Parameters?. Figure 1.

E N D
Milankovitch Cycles (Images from Unversity of Montana geology department website)
Vostok ice core record (from US global change research program website)
Figure 1 • SPECMAP assumes ice volume is related to orbital forcing and is tuned as such. • HW04 is independent of tuning for orbital factors. (Roe 2006) • SPECMAP plotted with 6kyr lag, HW04 with 8kyr lag. • Vertical units are scaled (and insolation reversed)
Linear regression of precession + obliquity massaged onto insolation (allowances made for amplitude and lag) • Vertical axes scaled. (Also, note different scale between SPECMAP and HW04) Figure 3 SPECMAP HW04
“Atmospheric CO2 has also been suggested as driving changes in global ice volume . . . Comparisons of the impacts of shortwave and longwave radiative forcing appropriate over the ice sheets are not straightforward, but taking summer half-year insolation variations in shortwave (Fig. 3), and assuming an albedo of 0.5 for melting ice, variations in summertime shortwave forcing exceed the direct CO2 radiative forcing by about a factor of five.” (Roe 2006)
Negative Phase value indicates CO2 signal lags behind rate of change of ice volume. • Vertical bars indicate obliquity and precession orbital periods. • Grey area represents 95% confidence interval for Phase range. • Note cross-spectral coherence at orbital periods, CO2 variations lag dV/dt. SPECMAP (Figure 4) HW04
Anthropocene? Human induced effects on climate?
Vostok ice core record (from US global change research program website)
CO2 follows expected pattern until 8000 years ago. • CO2 should actually be higher, to include amount that compensates for decrease expected of an interglacial cycle.
Proposed major cause: Land Clearance. • Estimated total Carbon from deforested areas by 2000 yrs BP: 224–249 Gt • Target amount by 2000 yrs BP for hypothesis: 255 Gt
Only plagues can affect enough of the human population on the regional scale over a short time interval. • The largest epidemic in history was the “Black Death” in the Middle ages (~1347-1377AD). Mortality rates reached up to 50% in many regions. The timing of this plague matches a 10ppm drop in CO2 seen in the Taylor Dome ice core record. • Mechanism is likely to be (must be?) carbon sequestering during re-growth of forest on abandoned farms and villages; models show this land can return to full carbon capacity in as little as 50 years.
Baffin Island: dead lichen from failed glaciers. • ∼2 ◦C warming in Northern Canada has prevented glaciation event 6000 years ago, as predicted by Milankovic forcing. • Offset glaciation?