Download
1 / 21
210 likes | 294 Views
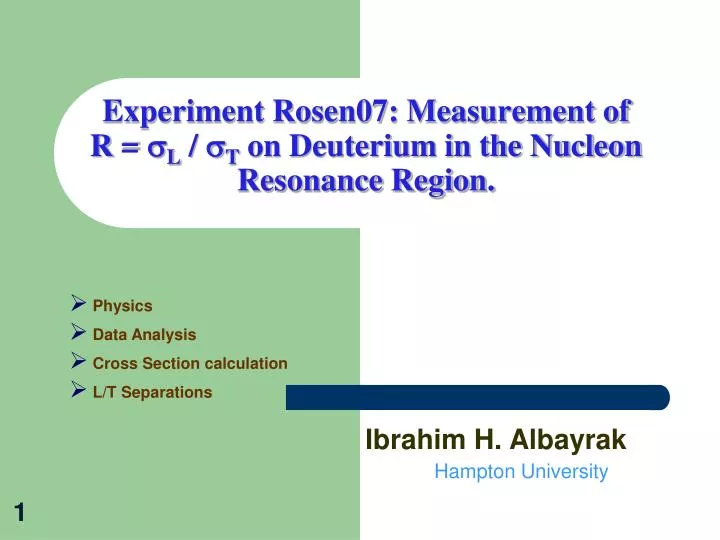
Experiment Rosen07: Measurement of R = s L / s T on Deuterium in the Nucleon Resonance Region. Physics Data Analysis Cross Section calculation L/T Separations. Ibrahim H. Albayrak. Hampton University. ROSEN07 and JAN05 experiments.

E N D
Experiment Rosen07: Measurement of R = sL / sT on Deuterium in the Nucleon Resonance Region. • Physics • Data Analysis • Cross Section calculation • L/T Separations Ibrahim H. Albayrak Hampton University
ROSEN07 and JAN05 experiments • ROSEN07 (E06-009) is the second phase of the experiment JAN05(E04-001) with higher Q2 data. • ROSEN07 is combination of two experiments: • Measurement ofR = sL / sT on Deuterium in the Nucleon Resonance Region.(I.Albayrak) • Measurement ofR = sL / sT on Nuclear targets in the Nucleon Resonance Region.(VaheMamyan) • JAN05 is combination of two experiments: • Measurement ofR = sL / sT on Deuterium in the Nucleon Resonance Region.(Ya Li) • Measurement ofR = sL / sT on Nuclear targets in the Nucleon Resonance Region.(Ya Li)
Physics Physics Motivation • FL, F1, F2 and R fundamental Structure Function Measurements on Deuterium. - These structure functions provide us important information about internal structure of nucleon, i. e. distribution of quarks and gluons inside the nucleus. • Since these are fundamental measurements, they allow a variety of physics issues to be addressed, such as: • Structure Function Moments • Lattice QCD comparisons • Singlet and non-singlet distribution functions • Quark-hadron duality studies • Neutron form factors. • Support Broad Range of Deuteron Physics • Spin structure functions • BONUS (BOund NUcleon Structure) neutron structure functions - Hall B experiment for NEUTRON cross sections via spectator tagging.
Physics Calculable in Quantum Electrodynamics (QED) Physics of Interest (Nucleon Structure) Structure Functions: F1, F2, FL { Structure functions (F1 and F2) which have the Information of the nucleon’s internal structure.
Physics Transverse longitudinal Rosenbluth Separation Technique: Where: = flux of transversely polarized virtual photons = relative longitudinal flux
Physics Moments of the Structure Functions Md – 2Mp = ∫xn-2 (Fd∙f – 2Fp)dx yields non-singlet distribution • Mn(Q2) = ∫dx xn-2F(x,Q2) • The non-singlet moments can only be determined from differences of proton and neutron moments. • Assuming a charge-symmetric sea, n-p isolates the non-singlet • Where • Need to pin down non-singlet (n-p) to extract singlet . Moments Calculated on the lattice at Q2 = 4 GeV2
Physics Purely New data with high Q2 above 3 GeV New data with higher Q2 And new epsilon points for LT separation ROSEN07 JAN05 ROSEN07 experiment is the second phase of this experiment, the first phase was JAN05 experiment…
Experiment & Data analysis Current Status and Update • Detector Calibrations • Kinematic Corrections • Dead Times • Efficiencies • Background Estimation and Subtraction: • Target Density Correction • Acceptance Corrections • Bin-centering corrections • Radiative corrections • Iteration Procedure • Systematic Uncertainties • Extracting Differential Cross Sections • Doing Rosenbluth L/T Separation • Moment extraction • N-p analysis
Experiment & Data analysis Data to Monte Carlo simulation comparisons…
Experiment & Data analysis Drift Chamber Positions Offsets Significantly different from previous data!!! Checked optics elements, magnets fields, matrix elements and no difference found from previous data. Could it be because of DC offsets?
Experiment & Data analysis Drift Chamber Positions Offsets X direction For drift chamber position offset study I studied the width of the Elastic peak and Xptar. The narrowest the peak the best the position. XpTar plots should not be correlated with DC positioning. Peak gets wider with any x offset No DC offset in X (vertical) direction! Must be Straight. Gets tilted with any x offset With X pos offset Without X pos offset
Experiment & Data analysis Drift Chamber Positions Offsets Y Direction Ytar plot for Carbon target should be narrowest with correct positions Without Y pos offset With Y pos offset There is about 0.45 mm relative offset (distance) between the DCs Peak gets narrower Slope of the valley gives the best Y offset!
Experiment & Data analysis Offsets for Drift Chamber Positions After putting the relative offset 0.45 mm for Y position we get better comparison! Before After After correction y pos gets narrow, which indicates that we are doing the right thing.
Experiment & Data analysis Target Position Study (Again) After getting correct position information for Drift Chambers, Target position study needed to be redone. Del Z (cm) Del X (cm) C -0.105 0.0928 D2 -0.0665 0.0382 Al -0.116 0.173 Fe -0.0861 0.0972 Cu -0.0764 0.0749
Experiment & Data analysis Elastic Study (Kinematic Corrections) Two simulation runs compared with and without radiative corrections to get the radiative effect on peak position. And correct elastic peak position calculated after subtracting the radiative effect.
Experiment & Data analysis Elastic Study (Kinematic Corrections) There is not enough data to do a precise kinematic offset study! All this data is consistent with very small (> 10-4 ) E and E’ offsets A possible 0.3 mrad Theta offset. On average it gives better results. Two Photon experiment has enough number of elastic H data. They could provide more precise results.
Experiment & Data analysis Cross Sections Extraction Method Monte Carlo ratio method is used to extract data cross sections: We can simulate Monte Carlo data using a cross section model to obtain YMC(E',q) = L* smod*( DE DW)*AMC(E',q) Taking ratio to data and assuming that AMC = A, yields ds/dWdE' = smod * (Y(E',q)/YMC(E',q)) (MC ratio method) Peter Bosted’s model used as input model. And this data has helped in the development of this model.
Experiment & Data analysis Cross Sections (preliminary)
Experiment & Data analysis And L/T Separations… • Here is some almost final rosenbluth separation plots for 2 different W2,Q2 pairs Advantage of this method: Systematic errors cancel.
Experiment & Data analysis And L/T Separations… Plots of R ,first one have Q2 range 0.5-2.25 second one Q2 range 2.25-4.5 for Carbon.
Experiment & Data analysis Summary • Calibrations are done. • Charge symmetric background subtraction, radiative corrections and other corrections are mostly done. • Some L/T separations have already been done (Vahe). • Continue data analysis • L/T separations • Moment extractions • n-p analysis