Download
1 / 12
130 likes | 402 Views
Water Supply Modeling. Analyzing the Effect of Water Supply Activities on Aquatic Life and Long-Term Water Availability. Why Do We Model Water Supply Activities?. Water is a renewable, but temporally finite resource It gets more scarce when we need it most!

E N D
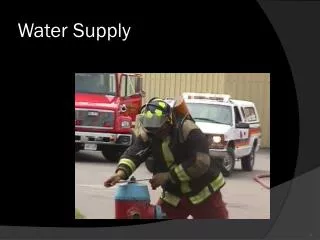
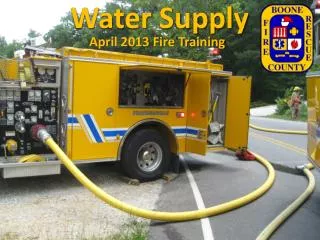
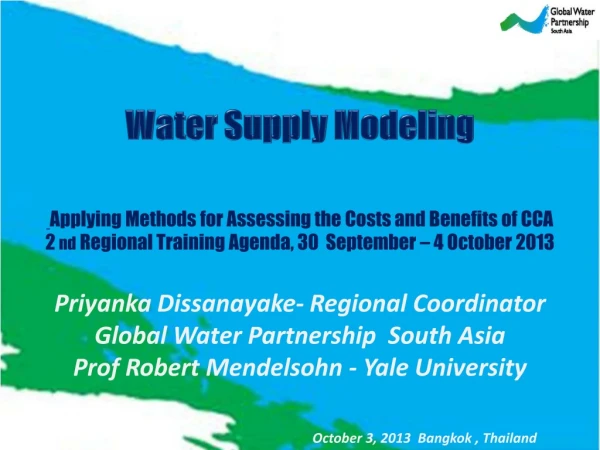
Water Supply Modeling Analyzing the Effect of Water Supply Activities on Aquatic Life and Long-Term Water Availability
Why Do We Model Water Supply Activities? • Water is a renewable, but temporally finite resource • It gets more scarce when we need it most! • Water withdrawals (and discharges) effect aquatic life • Some folks refer to the Eastern US as “water rich” … but recent droughts have seen well failures, emergency water trestrictions and locatlities “trucking water in”
Facts, Figures, Acronymns & Conversions • Facts: • Water supply modeling is a mass balance equation: • Qout = Qin + P + R – WD + PS • Figures: • Virginians currently use ~10% of annual stream flow • Virginians use > 50% of drought flows in some streams • Harmful effects of WD may be seen as soon as 20% • Acronyms: • Flow: cfs – Cubic Feet Per Second • Withdrawal: MGD – Million Gallons per Day • Storage: acft - acre-feet (foot of water on acre of land) • Conversions: • 1 MGD = 1.547 cfs
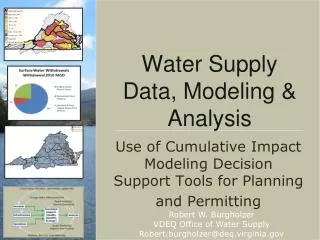
How Do We Model Water Supply • Do Cumulative Impact Analysis • Withdrawals • Discharges • Impoundments • Consider Ecology: • IFIM • Flow-Ecology statistical modeling • Looking towards the future • Water Supply Planning reg requires localities to prepare 30-50 year water use projections • We have built a modeling system to look at all of it
Our “Meta-Modeling” System • Integrates multiple sub-models • HSPF • GWLF • CBP Model (hspf based) • Remote data sources • USGS gages • NOAA rainfall • Online – web interface • Multi-user – collaborative
Tools We Will Use • VWUDS Databases • VPDES Database • Water Supply Plans • VWP Permits • Web-Based Modeling System • Integrated into a “Conflict Signal Tool”
What Kind of Comparisons do the Models Allow? “Pinch Points” or areas of potential conflict Changes to overall the Flow Regime Changes in Timing
Rappahannock: Balancing Withdrawals Model with Flow-By and Storage Demonstrated Tight, but sustainable water budget Water Supply Plan info and permit info suggested serious conflict
Pinch Points: How Will We Manage? Now Full Build-Out • Without new flow-by Rules, we definitely have adverse impact to off & on stream resources • Storage will probably be required to protect instream resources
Why Do We Need You?? • Data Sharing is Quality Assurance • More eyes is better for debugging! • Flow Ecology • Data visualization inspiration is needed • We need sharp minds & alternative ideas • Exploring alternatives • The Eastern US is a Water Supply Analysis Desert • Train people to meet challenges of an uncertain future