Download
1 / 8
80 likes | 188 Views
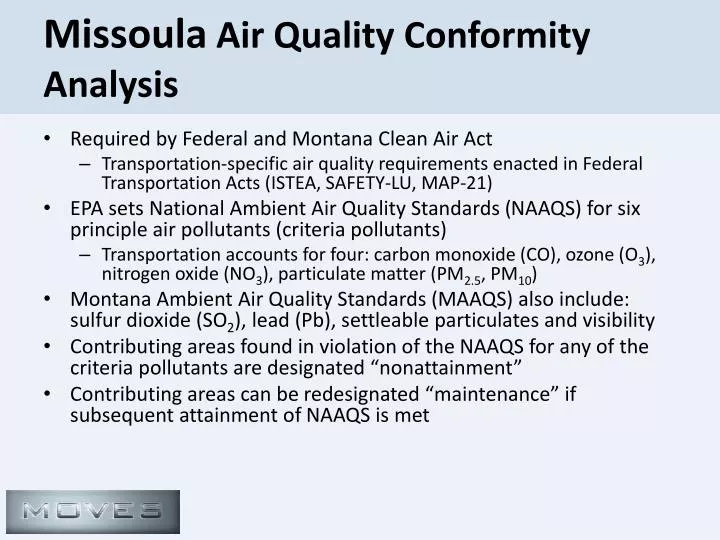
Missoula Air Quality Conformity Analysis. Required by Federal and Montana Clean Air Act Transportation-specific air quality requirements enacted in Federal Transportation Acts ( ISTEA , SAFETY-LU, MAP-21)

E N D
Missoula Air Quality Conformity Analysis • Required by Federal and Montana Clean Air Act • Transportation-specific air quality requirements enacted in Federal Transportation Acts (ISTEA, SAFETY-LU, MAP-21) • EPA sets National Ambient Air Quality Standards (NAAQS) for six principle air pollutants (criteria pollutants) • Transportation accounts for four: carbon monoxide (CO), ozone (O3), nitrogen oxide (NO3), particulate matter (PM2.5, PM10) • Montana Ambient Air Quality Standards (MAAQS) also include: sulfur dioxide (SO2), lead (Pb), settleable particulates and visibility • Contributing areas found in violation of the NAAQS for any of the criteria pollutants are designated “nonattainment” • Contributing areas can be redesignated “maintenance” if subsequent attainment of NAAQS is met
Missoula Air Quality Conformity Analysis (cont.) • Currently, Missoula is designated “maintenance” for CO and “nonattainment” for PM10 • Metropolitan Planning Organizations (MPOs) must provide a written conformity determination for transportation plans and TIPsinvolving designated nonattainment or maintenance areas for transportation-related criteria pollutants
Introduction to MOVES EPA Office of Transportation and Air Quality
What is MOVES? • MOtorVehicle Emission Simulator • State-of-the-art modeling framework • Replaces MOBILE for on-road vehicle emissions • Significant expansion of capabilities compared to MOBILE • Will also eventually include nonroad emissions to replace separate NONROAD model • Designed to allow easier incorporation of large amounts of in-use data from a variety of sources • MOBILE structure limited ability to incorporate new emissions data
How Is MOVES Different from MOBILE? • MOVES Software Structure Is More Flexible • MOVES Offers More Output Options • MOVES Covers Multiple Scales and Time Periods • MOVES Is a Modal Model • MOVES Is Also a Greenhouse Gas Model
How Do Emissions Differ from MOBILE? • Data collected since MOBILE6 released drives differences between MOVES and MOBILE6 • National trends • HC and CO emissions similar or lower than MOBILE6.2 • Total NOx emissions higher than MOBILE6.2 • Total PM emissions substantially higher than MOBILE6.2 • Local results may vary • Local fleet mix, fuels, activity are important • Temperature drives PM emissions • For attainment analysis, relative change in emissions between base year and attainment year is more important than absolute emissions
What It Means • Higher NOx and PM emissions mean on-road mobile sources have bigger role in attainment • Percent reduction from base year is key to attainment analysis • PM2.5 shows higher overall emissions and higher % reductions effect on attainment demonstrations could be positive • NOx shows higher overall emissions but lower % reduction could be harder to show attainment • Future NOx control measures could have a bigger impact • States need to evaluate these impacts and consider their effects on SIP and conformity requirements
Types of Input Data • Travel Demand Model Outputs by CO and PM10 boundaries • Average Speed Distribution • Hourly vehicle miles traveled (VMT) Fraction • Locally Specific Data • Distribution of vehicles by age for each vehicle type • Number of vehicles within each of 13 vehicle types for the base year (2011) • Market shares for the different fuel types used in the region • The composition of different fuels used in the region • Meteorological data representing temperature and humidity on a typical wintertime weekday • Total VMT by the 6 Highway Performance Monitoring System (HPMS) vehicle types in the base year