Download
1 / 17
170 likes | 318 Views
Carré & Jacobson. D(A;B). A. B. Soil profile distance measures and classifications. Application to an Australian soil dataset. Pedometrics 2007, 27-29/08/2007. Objectives. OSACA presentation. Application. To make a quantitative tool for soil profile classification.

E N D
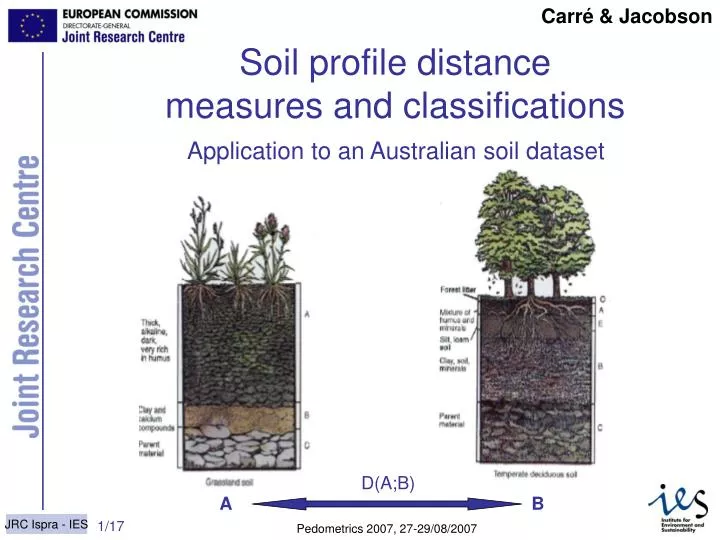
Carré & Jacobson D(A;B) A B Soil profile distance measures and classifications Application to an Australian soil dataset Carré & Jacobson Pedometrics 2007, 27-29/08/2007
Objectives OSACA presentation Application To make a quantitative tool for soil profile classification Which provides different types of distances according to the soil classification purpose Which is able to make supervised classification (principle of soil taxonomies) or unsupervised classification To test the quantitative tool relatively to Soil taxonomy purpose Available Water Capacity prediction Focusing on The input content of the classification (soil against terron) The number of classes (level of taxonomic detail) The classes robusteness (sensitivity of the distances) Carré & Jacobson
OSACA principles Max # solum centroids Min. # solum centroids Max. # Horizon centroids Min. # Horizon centroids Min+1 # solum centroids Min+1. # Horizon centroids Calculation of distances Calculation of distances horizons Soil observations Horizon classification Soil types Calculation of new centroids Dintra/Dinter ratio Dintra/Dinter ratio Solum classification Horizon types User requirements Calculation of new centroids Range of horizon classes Range of solum classes optimization Carré & Jacobson
OSACA principles D(obs,ref) Soil observations Result table Soil types Soil types dmin A B C D REF 1 0.7 0.1 0.3 1.3 B 0.1 Soil observations 2 2.5 1.5 0.1 0.6 C 0.1 3 0.6 0.1 1.2 0.4 B 0.1 4 0.8 0.1 1.9 0.2 B 0.1 5 0.1 0.1 1.2 0.0 3.0 A If user has references, only one iteration Carré & Jacobson
OSACA distances Horizon distances between horizon i and horizon k having n soil variables Euclidian distance Manhattan distance Carré & Jacobson
OSACA distances D (# D) Observation Reference 0 cm 0 cm A x 20 cm 30 cm B 60 cm y 80 cm z C 100 cm 120 cm Solum distances Pedological distance D(x,A) + D(x,B) + D(y,B) + D(y,C) + D(z,C) + D(?,C) Carré & Jacobson
OSACA distances D*e Max depth Observation Reference 0 cm 0 cm A x 20 cm 30 cm B 60 cm y 80 cm z C 100 cm 120 cm Solum distances Utilitarian distance D(x,A) + D(x,B) + D(y,B) + D(y,C) + D(z,C) + D(?,C) Carré & Jacobson
OSACA distances D (# D) Observation Reference 0 0 0 cm 0 cm A A x x 0.16 20 cm 30 cm 0.3 B B 60 cm y 0.5 y 80 cm 0.8 z C C 100 cm z 1 120 cm 1 Solum distances Joint distance D(x,A) + D(x,B) + D(y,B) + D(y,C) + D(z,C) Carré & Jacobson
Application Altitude Landsat ETM 7c Slope LS Panchromatic Aspect NDVI Plan curvature Clay Index (5/7) Profile curvature RS 30m CTI DEM 25m N K SPOT 4 U NDVI Th RS 20m 2m Edgeroi area Soil variables AWC 9 order names/ 20 subgroup names 341 soil profiles Carré & Jacobson
Application 0 cm 0 cm 10 cm 10 cm 20 cm 20 cm 30 cm 30 cm 40 cm 40 cm R, G, B (0- 255) 70 cm 70 cm 80 cm 80 cm 120 cm 120 cm 130 cm 130 cm s.depth Profile description Sand (%)/ Silt (%)/ Clay (%) pHH20 CaCO3 EC C Ca,Mg,Na Munsell Colour (Hue, Value, Chroma) Illuminant C two degrees observer (C 1931) http://WalkillColor.com Standardization of soil variables (320 soil profiles) Solum depth Carré & Jacobson
Tests Pool of soil variables Texture pHH20 CaCO3 EC C Ca,Mg,Na Munsell Colour Solum depth Lack in DB Testing OSACA classifications against soil taxonomy 1st question: Do we have enough data to speak about pedogenesis? Sufficient pool of variables Isbell et al. (1997) from Minasny & McBratney (to be published) Carré & Jacobson
Tests Allocation comparison ² test R²(U) likelihood-ratio 13 PC Landscape attributes Testing OSACA classifications against soil taxonomy Testing OSACA results against the 20 taxonomy suborders 18-25 Horizon classes 13 Soil variables 15 Landscape attributes PCA Terron classes 15-25 soil classes 15-25 terron classes OSACA run 35-45 soil classes 35-45 terron classes 19 classes 45 classes Pedological distance 18 classes 45 classes R= 40% R= 51% R= 38% R= 51% R= 41% R= 52% R= 38% R= 52% 20 classes 43 classes Utilitarian distance 24 classes 43 classes R= 30% R= 49% R= 33% R= 48% R= 31% R= 51% R= 34% R= 49% 20 classes 45 classes Joint distance 19 classes 44 classes R= 29% R= 62% R= 29% R= 50% R= 30% R= 63% R= 30% R= 52% Carré & Jacobson confusions (dmin+ 10%)
Tests 1m FC & PWP hor C AWCi= K + tdit + i R²adj prediction t=1 Testing OSACA classifications against Available Water Capacity (AWC) AWC1m predicted by Minasny (2007) from: Sand, Org C Bulk Density (BD) Sand, Clay, BD Field Capacity (FC) & Permanent Wilting Point (PWP) AWC SOIL TERRON 19 classes 45 classes Pedological distance 18 classes 45 classes R²adj= 77% R²adj= 82% R²adj= 72% R²adj= 83% 20 classes 43 classes Utilitarian distance 24 classes 43 classes R²adj= 57% R²adj= 71% R²adj= 58% R²adj= 69% 20 classes 45 classes Joint distance 19 classes 44 classes R²adj= 57% R²adj= 70% R²adj= 58% R²adj= 69% Carré & Jacobson
Conclusions OSACA is a good tool for transforming soil observations into quantitative classes. As a WebApplication, it is easy to use and as an open source, it can be modified. The quantitative soil and terron classes formed by OSACA are significatively correlated with soil taxonomy (if enough soil variables to describe the pedogenesis) and secondary soil variables. For dealing with soil taxonomy, the soil classes are better predictors than the terron classes. Joint distanceand pedological distances give better correlations between soil classes and Australian soil subgroups. For dealing with secondary soil variable, the pedological distance is the best predictor. With low and high number of classes, soil seems to be the best predictor. The terron does not increase so much the prediction. The allocation confusion due to close distances changes 1% of the correlations. The distances can be afterwards used for mapping purposes and for deriving uncertainties associated to predictions (DSM purposes). Carré & Jacobson
Enter your observations Enter your references (if you have some) ! Soon downloadable athttp://eusoils.jrc.it! Carré & Jacobson
Enter the number of horizon classes Enter the number of soil classes you want Carré & Jacobson
Get the results (tables) Carré & Jacobson