Download
1 / 43
610 likes | 1.16k Views
Passive-Microwave. The “other” microwave remote-sensing technology. It is Possible to Detect a Signal, However Weak, at Very Long Wavelengths. 100 micrometers. Note that there is radiation from thermal bodies even at longer wavelengths (extending into the microwave region of the spectrum).

E N D
Passive-Microwave The “other” microwave remote-sensing technology
It is Possible to Detect a Signal, However Weak, at Very Long Wavelengths 100 micrometers Note that there is radiation from thermal bodies even at longer wavelengths (extending into the microwave region of the spectrum).
Passive Microwave • Radar is active microwave; this is passive • The sensor detects natural microwave energy reflected and / or emitted from the Earth’s surface • All objects in the natural environment emit (and sometimes reflect) small amounts of passive microwave energy
Passive Microwave vs. Radar Radar Passive Microwave
Advantages of Passive Microwave • Independent of weather and clouds • Day or night operation • Includes imaging systems as well as non-imaging radiometers
Characteristics of Passive-Microwave Sensors • Generally operate between 0.15 and 30 cm in wavelength (some overlap with radar wavelengths) • Wide bandwidths are typical in order to provide sufficient signal to compile an image • Spatial resolution is poor due to the need for large pixels (related to weak signal) • Imaging systems have a moving antenna
Wavelength Range for Passive Microwave Notice the small amount of radiant exitance at these long wavelengths 0.15-30 cm
Passive-Microwave Sensing • In some ways, more like thermal-infrared than radar remote sensing (could be thought of as thermal scanning within microwave region) • The magnitude of passive-microwave emission is proportional to the product of the emissivity of the target and its surface temperature
Signal Recorded as Brightness Temperature • Ameasure of the total emissive characteristics of an object (it is different from kinetic temperature) • Defined as the temperature a black body in thermal equilibrium with its surroundings would have to be in order to duplicate the observed intensity (radiance) of a grey body target at a specific wavelength • Scientific unit of measure = K
Brightness Temperatures over Geographic Space Can be Imaged and Displayed Antarctic brightness temperatures, 23 February 2004 (25 km pixels) http://nsidc.org/daac/projects/passivemicro/amsre.html
Early Scanning Radiometers The antenna moves sideways to produce multiple scan lines. The result is a swath of image data The variations in intensity, when converted to photographic gray levels, yield images Note the poor spatial resolution
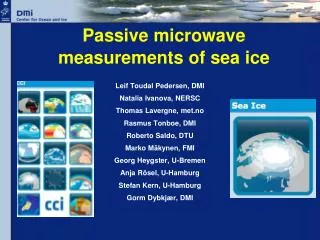
Today’s Passive Microwave Systems Advanced Scanning Microwave Radiometer for EOS (AMSR-E) On-board NASA’s Aqua Platform (along with MODIS) Dedicated to observing climate and hydrology A multi-frequency (wavelength) (6 channels), dual-polarized microwave radiometer Provides global, continuous observation Spatial resolution is variable (6 to 57 km)
AMSR-E: Retrievable Geophysical Parameters • Water vapor • Cloud liquid water • Precipitation • Sea-surface temperature • Sea-ice concentration • Snow-water equivalents • Soil moisture
Passive Microwave: Applications Brightness temperatures for arctic sea ice. Differences are indicative of variable ice characteristics (e.g., moisture content, age, thickness) http://nsidc.org/data/amsre/gallery/ae_si25_ist_north.html
Data Retrieval in Timely Manner Sea Ice Concentration: Arctic
Passive Microwave: Applications Sea ice concentration: Antarctica 0 percent (purple) to 100 percent (white) on 07 August 2004. Antarctica is shown in grey, and the unfrozen ocean is shown in dark blue. Sea ice concentration was calculated from data measured by the Advanced Microwave Scanning Radiometer–Earth Observing System (AMSR-E) sensor aboard NASA's Aqua satellite.
AMSR-E Sea-Ice Monitoring The inset shows changes in sea-ice extent over time for a localized area along the coast of Antarctica The repetitive (multi-temporal) coverage of the AMSR-E allows for the animation of scenes. http://polynya.gsfc.nasa.gov/seaice_amsr_south.html
AMSR-E Automated Iceberg Tracking Date of imaging Multi-temporal coverage allows for the tracking of large icebergs http://polynya.gsfc.nasa.gov/seaice_amsr_south.html
SSM/I (Special Sensor Microwave / Imager) on DMSP (Defense Meteorological Satellite Program) Arctic ice. Left: winter; Right: summer http://rst.gsfc.nasa.gov/Sect8/Sect8_8.html
Greenland: Accumulated Melt, 1979-2007, DMSP/SSMI & Nimbus-7 SMMR Source: NASA Images
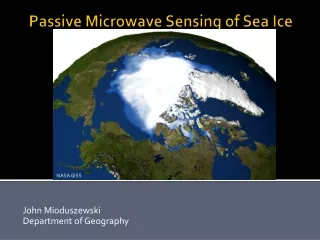
The image above was made from observations collected by the Advanced Microwave Scanning Radiometer (AMSR-E) on NASA’s Aqua satellite. The map—which looks down on the North Pole—depicts sea ice extent on September 9, 2011, the date of minimum extent for the year. Ice-covered areas range in color from white (highest concentration) to light blue (lowest concentration). Open water is dark blue, and land masses are gray. The yellow outline shows the median minimum ice extent for 1979–2000; that is, areas that were at least 15 percent ice-covered in at least half the years between 1979 and 2000.
Passive Microwave: Applications Global snow depth (in cm) from AMSR-E
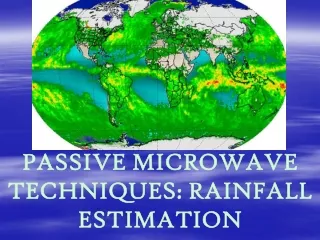
The technique involves assessing the extent to which raindrops interfere with the terrestrial passive-microwave signal AMSR-E Rain-Rate Product Hurricane Katrina http://wwwghcc.msfc.nasa.gov/sport/library/gallery.html
Soil Moisture Passive Microwave: Applications This is an excellent mechanism for measuring soil moisture over large geographic areas. A problem is the coarse spatial resolution.
Using AMSR-E Soil Moisture Data to Study the Extent of the March 2004 Flood
Passive Microwave: Applications Note timeliness http://sharaku.eorc.jaxa.jp/AMSR/index.html
Passive Microwave for Monitoring SST • Con: weaker signal than thermal infrared, so spatial resolution is quite poor • Pro: longer wavelength; no problems with clouds Thermal Infrared White pixels are clouds Passive Microwave
AMSR-E Sea-Surface Temperatures: Before and After Hurricane Gustav Top: 28Aug08 Bottom: 1Sep08 Note the cooler waters after the hurricane http://wwwghcc.msfc.nasa.gov/sport/library/gallery.html
TRMM: Total Rainfall Measuring Mission • Launched 1997: NASA and NASDA (Japan) • TMI: Tropical Microwave Imager • Provides quantitative rainfall data over a 487 mile wide swath • 5 km spatial resolution • 5 frequencies (wavelengths) in the passive microwave; dual polarization • More raindrops = warmer signal; rainfall rate linked to scene temperature
TRMM Rainfall Rate 28 October 2011 Tropical Depression: Rina http://trmm.gsfc.nasa.gov/images_dir/rina_28oct11_0753_utc.jpg
TRMM Precipitation Radar (TPR): Cloud Heights 28 October 2011 Tropical Depression: Rina
UNL Passive-Microwave Radiometer Passive-microwave antenna Non-imaging system SNR / CALMIT “Radar Van” with a passive-microwave radiometer installed at the end of the boom Wetland canopies at ARDC (Mead, NE) used for testing passive-microwave radiometer. Note that the instrument on the boom (shown above) is an ASD spectroradiometer; not a passive-microwave radiometer.
Controlled Wetland Plots • Done at the CALMIT research facility, ARDC, near Mead, NE • Water levels / depths in vegetation plots were controlled • Study done throughout the growing season, with several different water levels at each sampling
Purpose Of The EE / CALMIT Passive-Microwave Study of Wetlands • Determine if standing water could be detected beneath a full canopy of aquatic vegetation • Sensor of choice – passive microwave • Rationale – water levels are related to hydrostatic pressure, which is related to the fluxes of methane gas to the atmosphere • Higher water level = higher pressure = low flux of methane (and vice-versa)
Methane • A very efficient greenhouse gas, so it should be monitored • 20 times more effective in trapping heat in the atmosphere than carbon dioxide • Wetlands are important sources of methane • Nebraska has large expanses of wetlands in the Sandhills and Rainbasin areas of the state T T ... ... B B = = e e q q T T [ [ f f , , ] ] [ [ f f , , ] ] T T B B physical physical • T • T - Brightness Temperature. - Brightness Temperature. B B Temperature at which emitting body Temperature at which emitting body would be if it were a black body. Satellite would be if it were a black body. Satellite observes T observes T . . B B • T • T - physical temp. of emitting body. - physical temp. of emitting body. physical physical • e - emissivity. Range from 0-1. • e - emissivity. Range from 0-1. Measures how close body is to blackbody. Measures how close body is to blackbody. • f - frequency; q - polarization • f - frequency; q - polarization
Water Versus No Water Wavelength = 18.7 cm (L-band) No Water Water Angle of incidence UNL Masters Thesis by Rick Howard, EE, 1996
Growing Season Profile of TB Note increasing brightness temperature with increasing LAI
Polarization Comparisons VPOL VPOL HPOL HPOL Note increasing divergence of signal with increasing incidence angle
TB Response To Varying Water Depth Note decreasing brightness temperature with increasing depth of surface water beneath the vegetation canopy
Conclusions: Proximal Sensing Study • The L-band passive-microwave radiometer has a sensitivity to several key physical parameters associated with wetland environments, such as density of canopy, height of canopy, the spatial configuration of the vegetation, and the depth of water beneath the canopy • Brightness temperature increased with increasing LAI • Most importantly, the effect of varying surface-water depth is evident in the radiometric signature (i.e., we can “see” through a full canopy of wetland vegetation) • The problem: coarse spatial resolution of satellite sensors