Download
1 / 15
150 likes | 154 Views
Youth grows taller In 1998 the average height of both young males and young females in the Netherlands is represented in this graph. QUESTION 6.1

E N D
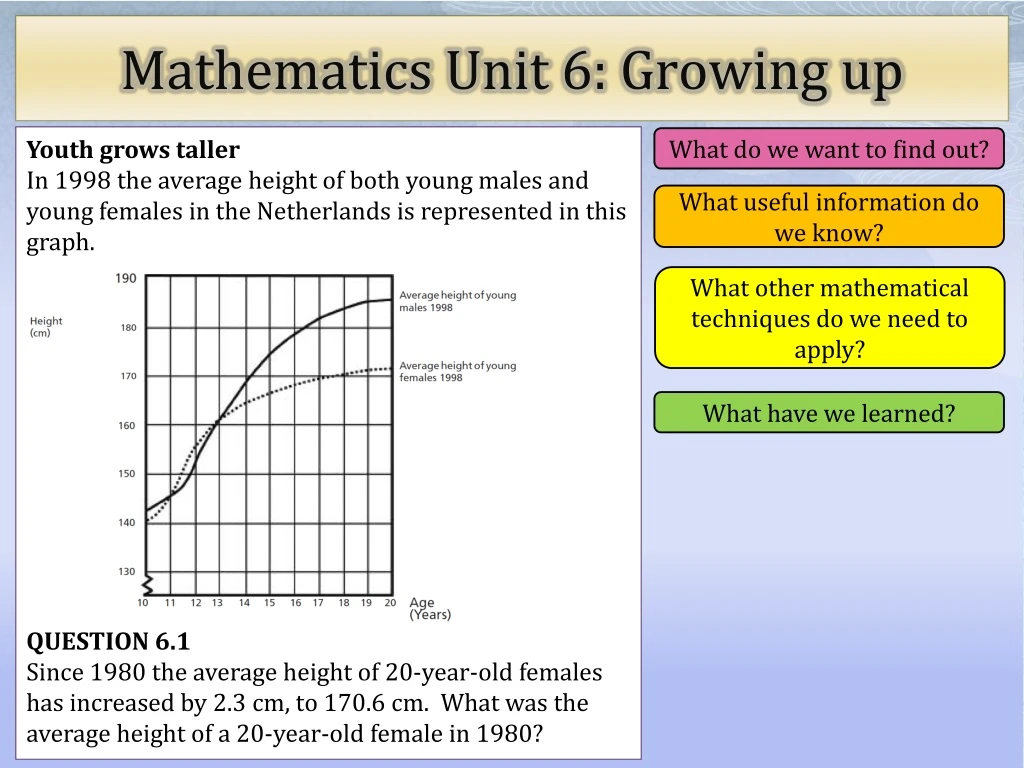
Youth grows taller In 1998 the average height of both young males and young females in the Netherlands is represented in this graph. QUESTION 6.1 Since 1980 the average height of20-year-old females has increased by 2.3 cm, to 170.6 cm. What was the average height of a 20-year-old female in 1980? What do we want to find out? What useful information do we know? Mathematics Unit 6: Growing up What other mathematical techniques do we need to apply? What have we learned?
Youth grows taller In 1998 the average height of both young males and young females in the Netherlands is represented in this graph. QUESTION 6.1 Since 1980 the average height of20-year-old females has increased by 2.3 cm, to 170.6 cm. What was the average height of a 20-year-old female in 1980? What do we want to find out? What useful information do we know? Mathematics Unit 6: Growing up What other mathematical techniques do we need to apply? What have we learned? Back to start
Youth grows taller In 1998 the average height of both young males and young females in the Netherlands is represented in this graph. QUESTION 6.1 Since 1980 the average height of20-year-old females has increased by 2.3 cm, to 170.6 cm. What was the average height of a 20-year-old female in 1980? What do we want to find out? What useful information do we know? Mathematics Unit 6: Growing up What other mathematical techniques do we need to apply? What have we learned? Back to start
Youth grows taller In 1998 the average height of both young males and young females in the Netherlands is represented in this graph. QUESTION 6.1 Since 1980 the average height of20-year-old females has increased by 2.3 cm, to 170.6 cm. What was the average height of a 20-year-old female in 1980? What do we want to find out? What useful information do we know? Mathematics Unit 6: Growing up What other mathematical techniques do we need to apply? What have we learned? Back to start
Youth grows taller In 1998 the average height of both young males and young females in the Netherlands is represented in this graph. QUESTION 6.1 Since 1980 the average height of20-year-old females has increased by 2.3 cm, to 170.6 cm. What was the average height of a 20-year-old female in 1980? What do we want to find out? What useful information do we know? Mathematics Unit 6: Growing up What other mathematical techniques do we need to apply? What have we learned? Back to start
Youth grows taller In 1998 the average height of both young males and young females in the Netherlands is represented in this graph. QUESTION 6.2 Explain how the graph shows that on average the growth rate for girls slows down after 12 years of age. What do we want to find out? What useful information do we know? Mathematics Unit 6: Growing up What other mathematical techniques do we need to apply? What have we learned?
Youth grows taller In 1998 the average height of both young males and young females in the Netherlands is represented in this graph. QUESTION 6.2 Explain how the graph shows that on average the growth rate for girls slows down after 12 years of age. What do we want to find out? What useful information do we know? Mathematics Unit 6: Growing up What other mathematical techniques do we need to apply? What have we learned? Back to start
Youth grows taller In 1998 the average height of both young males and young females in the Netherlands is represented in this graph. QUESTION 6.2 Explain how the graph shows that on average the growth rate for girls slows down after 12 years of age. What do we want to find out? What useful information do we know? Mathematics Unit 6: Growing up What other mathematical techniques do we need to apply? What have we learned? Back to start
Youth grows taller In 1998 the average height of both young males and young females in the Netherlands is represented in this graph. QUESTION 6.2 Explain how the graph shows that on average the growth rate for girls slows down after 12 years of age. What do we want to find out? What useful information do we know? Mathematics Unit 6: Growing up What other mathematical techniques do we need to apply? What have we learned? Back to start
Youth grows taller In 1998 the average height of both young males and young females in the Netherlands is represented in this graph. QUESTION 6.2 Explain how the graph shows that on average the growth rate for girls slows down after 12 years of age. What do we want to find out? What useful information do we know? Mathematics Unit 6: Growing up What other mathematical techniques do we need to apply? What have we learned? Back to start
Youth grows taller In 1998 the average height of both young males and young females in the Netherlands is represented in this graph. QUESTION 6.3 According to this graph, on average, during which period in their life are females taller than males of the same age? What do we want to find out? What useful information do we know? Mathematics Unit 6: Growing up What other mathematical techniques do we need to apply? What have we learned?
Youth grows taller In 1998 the average height of both young males and young females in the Netherlands is represented in this graph. QUESTION 6.3 According to this graph, on average, during which period in their life are females taller than males of the same age? What do we want to find out? What useful information do we know? Mathematics Unit 6: Growing up What other mathematical techniques do we need to apply? What have we learned? Back to start
Youth grows taller In 1998 the average height of both young males and young females in the Netherlands is represented in this graph. QUESTION 6.3 According to this graph, on average, during which period in their life are females taller than males of the same age? What do we want to find out? What useful information do we know? Mathematics Unit 6: Growing up What other mathematical techniques do we need to apply? What have we learned? Back to start
Youth grows taller In 1998 the average height of both young males and young females in the Netherlands is represented in this graph. QUESTION 6.3 According to this graph, on average, during which period in their life are females taller than males of the same age? What do we want to find out? What useful information do we know? Mathematics Unit 6: Growing up What other mathematical techniques do we need to apply? What have we learned? Back to start
Youth grows taller In 1998 the average height of both young males and young females in the Netherlands is represented in this graph. QUESTION 6.3 According to this graph, on average, during which period in their life are females taller than males of the same age? What do we want to find out? What useful information do we know? Mathematics Unit 6: Growing up What other mathematical techniques do we need to apply? What have we learned? Back to start