Download
1 / 1
10 likes | 164 Views
DP Sensor. Table 2. Numerical results of the design parameters for the 10L/min. INTRODUCTION. PRODUCT DESIGN. CALIBRATION EXPERIMENTS.

E N D
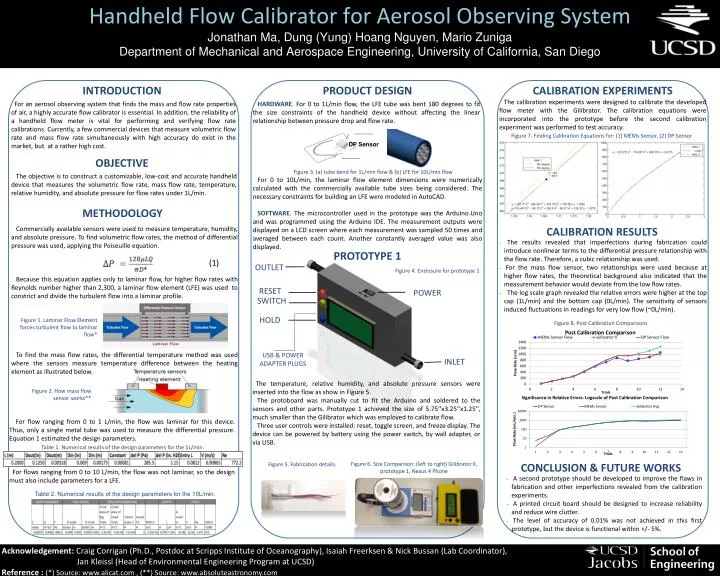
DP Sensor Table 2. Numerical results of the design parameters for the 10L/min. INTRODUCTION PRODUCT DESIGN CALIBRATION EXPERIMENTS The calibration experiments were designed to calibrate the developed flow meter with the Gilibrator. The calibration equations were incorporated into the prototype before the second calibration experiment was performed to test accuracy. For an aerosol observing system that finds the mass and flow rate properties of air, a highly accurate flow calibrator is essential. In addition, the reliability of a handheld flow meter is vital for performing and verifying flow rate calibrations. Currently, a few commercial devices that measure volumetric flow rate and mass flow rate simultaneously with high accuracy do exist in the market, but at a rather high cost. HARDWARE. For 0 to 1L/min flow, the LFE tube was bent 180 degrees to fit the size constraints of the handheld device without affecting the linear relationship between pressure drop and flow rate. Figure 7. Finding Calibration Equations for: (1) MEMs Sensor, (2) DP Sensor OBJECTIVE Figure 3. (a) tube bend for 1L/min flow & (b) LFE for 10L/min flow The objective is to construct a customizable, low-cost and accurate handheld device that measures the volumetric flow rate, mass flow rate, temperature, relative humidity, and absolute pressure for flow rates under 1L/min. For 0 to 10L/min, the laminar flow element dimensions were numerically calculated with the commercially available tube sizes being considered. The necessary constraints for building an LFE were modeled in AutoCAD. Handheld Flow Calibrator for Aerosol Observing SystemJonathan Ma, Dung (Yung) Hoang Nguyen, Mario ZunigaDepartment of Mechanical and Aerospace Engineering, University of California, San Diego METHODOLOGY SOFTWARE. The microcontroller used in the prototype was the Arduino.Uno and was programmed using the Arduino IDE. The measurement outputs were displayed on a LCD screen where each measurement was sampled 50 times and averaged between each count. Another constantly averaged value was also displayed. CALIBRATION RESULTS Commercially available sensors were used to measure temperature, humidity, and absolute pressure. To find volumetric flow rates, the method of differential pressure was used, applying the Poiseuilleequation. Because this equation applies only to laminar flow, for higher flow rates with Reynolds number higher than 2,300, a laminar flow element (LFE) was used to constrict and divide the turbulent flow into a laminar profile. To find the mass flow rates, the differential temperature method was used where the sensors measure temperature difference between the heating element as illustrated below. • The results revealed that imperfections during fabrication could introduce nonlinear terms to the differential pressure relationship with the flow rate. Therefore, a cubic relationship was used. • For the mass flow sensor, two relationships were used because at higher flow rates, the theoretical background also indicated that the measurement behavior would deviate from the low flow rates. • The log scale graph revealed the relative errors were higher at the top cap (1L/min) and the bottom cap (0L/min). The sensitivity of sensors induced fluctuations in readings for very low flow (~0L/min). PROTOTYPE 1 (1) OUTLET Figure 4. Enclosure for prototype 1 RESET POWER SWITCH HOLD Figure 1. Laminar Flow Element forces turbulent flow to laminar flow* Figure 8. Post Calibration Comparisons USB & POWER ADAPTER PLUGS INLET The temperature, relative humidity, and absolute pressure sensors were inserted into the flow as show in Figure 5. The protoboard was manually cut to fit the Arduino and soldered to the sensors and other parts. Prototype 1 achieved the size of 5.75’’x3.25’’x1.25’’, much smaller than the Gilibrator which was employed to calibrate flow. Three user controls were installed: reset, toggle screen, and freeze display. The device can be powered by battery using the power switch, by wall adapter, or via USB. Figure 2. How mass flow sensor works** For flow ranging from 0 to 1 L/min, the flow was laminar for this device. Thus, only a single metal tube was used to measure the differential pressure. Equation 1 estimated the design parameters. For flows ranging from 0 to 10 L/min, the flow was not laminar, so the design must also include parameters for a LFE. Table 1. Numerical results of the design parameters for the 1L/min. Figure 6. Size Comparison: (left to right) Gilibrator II, prototype 1, Nexus 4 Phone CONCLUSION & FUTURE WORKS Figure 5. Fabrication details. • A second prototype should be developed to improve the flaws in fabrication and other imperfections revealed from the calibration experiments. • A printed circuit board should be designed to increase reliability and reduce wire clutter. • The level of accuracy of 0.01% was not achieved in this first prototype, but the device is functional within +/- 5%. Acknowledgement: Craig Corrigan (Ph.D., Postdoc at Scripps Institute of Oceanography), Isaiah Freerksen & Nick Bussan (Lab Coordinator), Jan Kleissl (Head of Environmental Engineering Program at UCSD) Reference : (*) Source: www.alicat.com , (**) Source: www.absoluteastronomy.com