Download
1 / 16
330 likes | 750 Views
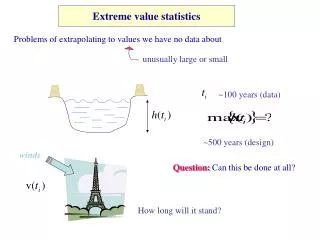
Extreme Value Analysis. What is extreme value analysis?. Extreme Value Analysis Fit. Different statistical distributions that are used to more accurately describe the extremes of a distribution Normal distributions don’t give suitable information in the tails of the distribution

E N D
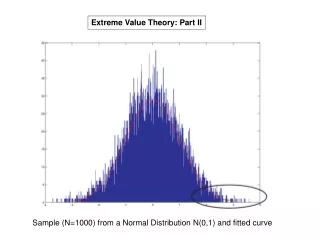
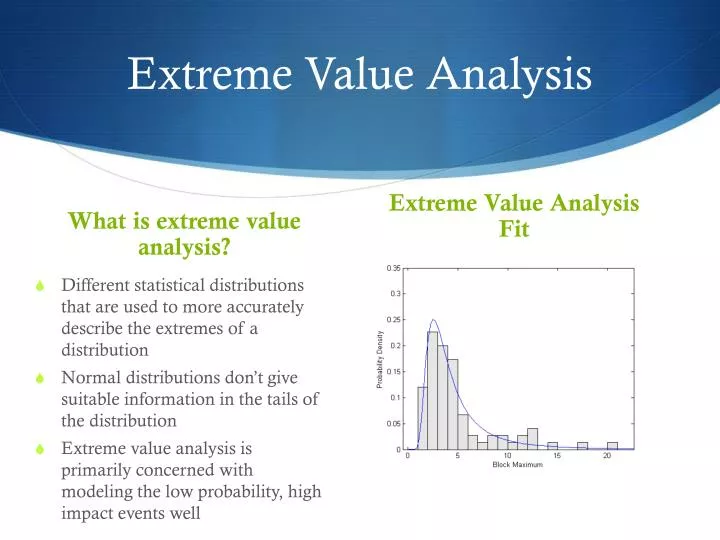
Extreme Value Analysis What is extreme value analysis? Extreme Value Analysis Fit • Different statistical distributions that are used to more accurately describe the extremes of a distribution • Normal distributions don’t give suitable information in the tails of the distribution • Extreme value analysis is primarily concerned with modeling the low probability, high impact events well
Extreme Value Analysis-Why is it Important to Model the Extremes Correctly? • Imagine a shift in the mean, from A to B • In the new scenario (B) most of the data is pretty similar to A • However, in the extremes of the distribution we see changes > 200%!
Extreme Value Analysis • Changes in the mean, variance and/or both create the most significant changes in the extremes • Risk communication is critical “Man can believe the impossible, but man can never believe the improbable” --Oscar Wilde (Intentions, 1891)
Extreme Value Analysis - Uses • Climatology • Hurricanes, heat waves, floods • Reinsurance Industry • Assessing risk of extreme events • Wall Street • Market extremes and threshold exceedence potentials • Hydrology • Floods, dam design • Water Demand!
Two Approaches To EVA Block Maxima Points over Threshold shape parameter k scale parameter σ threshold parameter θ Used… …in instances where data is limited …when user would like to know with what frequency extreme events will occur • location parameter µ • scale parameter σ • shape parameter k • Used… • …in instances where maximums are plentiful • …when user would like to know the magnitude of an extreme event
Case Study Introduction • Water demand data from Aurora, CO • Used for NOAA/AWWA study on the potential impacts of climate change on water demand
Generalized Extreme Value Distribution: Block Maxima Approach ‘Block’ or Summer Seasonal Maxima in Aurora, CO Issues For water demand data ‘blocks’ could be annual or seasonal However, this leaves us with a very limited amount of data to fit the GEV with for Aurora This is not an appropriate method to use because of the limited data
GEV: Block Maxima Approach Aurora, CO Seasonal Monthly Maximums Compromise Not a true maxima However, it allows GEV modeling on smaller data sets An acceptable approach for GEV modeling
GPD: Points Over Threshold Approach Daily Water Demand; Aurora, CO Approach Choose some high threshold Fit the data above the threshold to a GPD to get intensity of exceedence Fit the same data to Point Process to get frequency of exceedence
GPD: Points Over Threshold Approach Capacity of Points Over Threshold Process • Uses more data than GEV • Can answer questions like ‘what’s the probability of exceeding a certain threshold in a given time frame?’ or ‘How many exceedences do we anticipate?’ • We can also see how return levels will change under given IPCC climate projections • This will give an idea about the impact of climate on water demand
Points Over Threshold Use The point process fit is a Poisson distribution that indicates whether or not an exceedence will occur at a given location The point process fit couples with the GPD fit will be used to model the data
Non-Stationary EVA Benefits Potential covariates Precipitation Temperatures Spell statistics Population Economic forecasts etc • Allows flexible, varying models • Improved forecasting capacity • Trends in models apparent
Stationary GEV Unconditional GEV
Conditional GEV Shifts with Climate Covariates (Towler et al., 2010)
Conditional GEV Shifts with Climate Covariates Q90 P[S>Q90Uncond] ?? 40% 10% 3% (Towler et al., 2010)
Non-Stationary Case Generalized Parateo Distribution • We can allow the extreme value parameters to vary with respect to a variety of covariates • Covariates will be the climate indicators we have been building (temp, precip, PDSI, spells, etc) • Forecasting these covariates with IPCC climate models will give the best forecast of water demand • Climate is non-stationary, water demand fluctuations with respect to climate will also not be stationary