Download
1 / 1
10 likes | 113 Views
250. 200. 150. 100. 50. 0. Th0. Th1. Th2. Liver. Th17-2. Th17-1. Th17-3. Tbet. 400. GATA3. 300. 200. 400. 100. 300. 0. 200. 100. 0. Suppl Figure 1. a. b. c. AhR. FoxP3. AhR. 1000. 15. mRNA level to HPRT (x10 -3 ). mRNA level to HPRT (x10 -3 ).

E N D
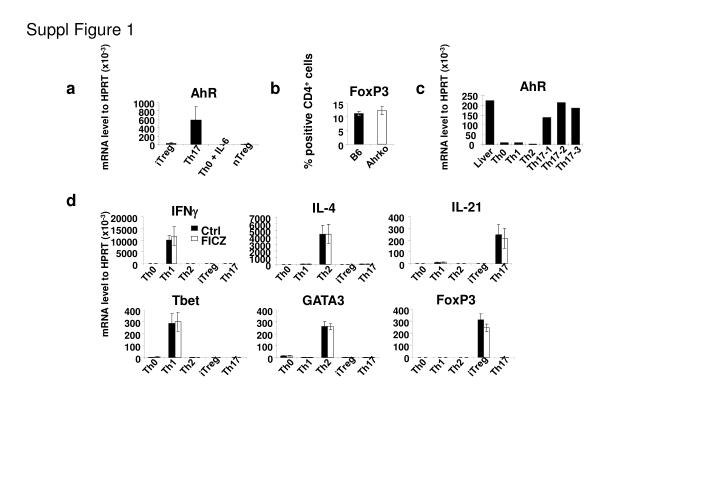
250 200 150 100 50 0 Th0 Th1 Th2 Liver Th17-2 Th17-1 Th17-3 Tbet 400 GATA3 300 200 400 100 300 0 200 100 0 Suppl Figure 1 a b c AhR FoxP3 AhR 1000 15 mRNA level to HPRT (x10-3) mRNA level to HPRT (x10-3) % positive CD4+ cells 800 10 600 400 5 200 0 0 nTreg B6 iTreg Th17 Ahrko Th0 + IL-6 d IL-21 IL-4 IFNg 400 20000 7000 6000 Ctrl 300 15000 5000 4000 FICZ 200 10000 3000 2000 5000 100 1000 0 0 0 iTreg iTreg iTreg Th17 Th17 Th17 Th2 Th2 Th0 Th0 Th1 Th1 Th1 Th2 Th0 mRNA level to HPRT (x10-3) FoxP3 400 300 200 100 0 iTreg iTreg iTreg Th17 Th17 Th17 Th0 Th1 Th0 Th1 Th1 Th2 Th0 Th2 Th2