Download
1 / 42
420 likes | 534 Views
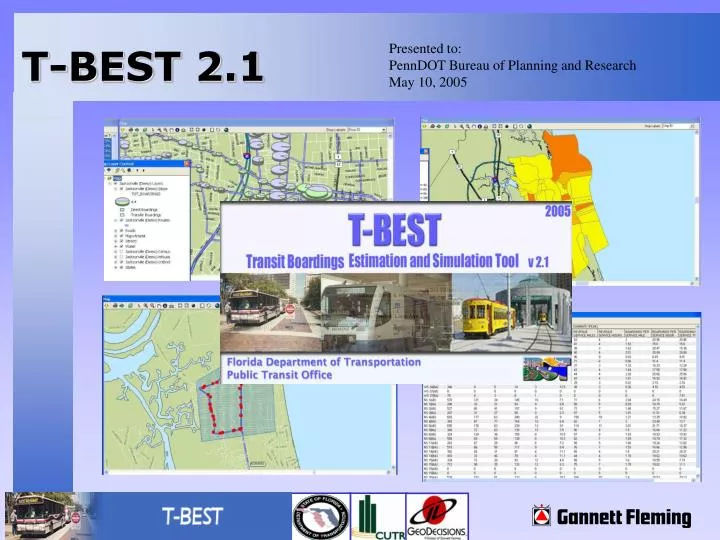
T-BEST 2.1. Presented to: PennDOT Bureau of Planning and Research May 10, 2005. T-BEST 2.1. Project Team. Florida Department of Transportation, Public Transit Office Center for Urban Transportation Research (CUTR) University of South Florida GeoDecisions, A Division of Gannett Fleming

E N D
T-BEST 2.1 Presented to: PennDOT Bureau of Planning and Research May 10, 2005 T-BEST 2.1
Project Team • Florida Department of Transportation, Public Transit Office • Center for Urban Transportation Research (CUTR) • University of South Florida • GeoDecisions, A Division of Gannett Fleming • Gannett Fleming, Inc.
Outline • Need for T-BEST • T-BEST Applications • T-BEST Model Concepts • T-BEST Analysis • T-BEST Software Overview • T-BEST Implementation • Conclusions • Future Enhancements • Demonstration
Need For T-BEST • Systems Planning Software • Traditional 4 Step Planning Travel Models • Long term (20+years), Systems Level • Multimodal • Primarily Suited for Major Investment Studies
Need For T-BEST • Transit Operational Level Software • Trapeze, Hastus • Routing & Scheduling • Do Not Allow for Evaluation of Service Alternatives
T-BEST Applications What is T-BEST? • Comprehensive Transit Network Modeling, Management and Analysis Software designed for short-term transit planning • Direct and Transfer Stop-Level Boardings Estimation
T-BEST Applications • Service Planning • Stop/Route Adjustments based on: • Seasonal Patterns • Land Use Changes • Road Construction • Service Changes • Short-Term Ridership Forecasting • Adjust Socio-Economic for expected growth • Fare Structure changes • New Routes, Stops • New Technologies (BRT, Rail, Trolley, etc)
T-BEST Applications • Support for Transit Development Plans • Transit System Management • Network Editing/Coding • Integration with ArcGIS • Can serve as a baseline operational software
T-BEST Model Concepts • Transit systems planning considerations: • Accessibility • Availability • Quality of Service • Ridership • Temporal Characteristics • Transfers • Route/Network Design • Fare Policies and Structure • Alternative Modal Options/Technologies/Route Types • Disaggregate Stop-Level Analysis
T-BEST Model Concepts • Transit ridership strongly affected by: • Destination accessibility • Temporal availability • Network connectivity • Desire to have T-BEST sensitive to all three aspects of transit accessibility • Ability to test effects of alternative route and network design configurations on transit boardings
T-BEST Model Concepts Neighboring Stops • Riders may choose alternative stops, routes, destinations for pursuing activities • Neighboring stops effectively capture effects of competing routes/stops • Neighboring stops are those with overlapping buffers with subject stop • N1: Same Route, Same Direction • N2: Same Route, Opposite Direction • N3: Other Routes, Similar Destinations
T-BEST Model Concepts Network Accessibility Measures • H1: Stops from which one can reach the N3 neighboring stops (Interest: Feeders for potential transfers) • H2: Downstream stops that can be reached from subject stop via the transit network (Interest: Capture potential downstream activities) • H3: Upstream stops that can be reached from the N2 stops (Interest: Capture potential upstream activities) • H4: Stops that can be reached from the N3 neighboring stops (Interest: Capture potential activities on other routes) • H5: Stops in H4 that overlap with stops in H3 (Interest: Capture potential competing activities)
T-BEST Model Concepts • Computing Transit Accessibility • Access / Egress at Given Stop • Accessibility to Other Stops • Composite Impedance Factors • Wait Time • Boarding Time • In-vehicle Time • # of Transfers • Transit Walking Time • Transfer Fare
T-BEST Model Concepts • Estimate Boardings at a Stop by: • Route • Direction • Time Period • Model Estimates two Boarding Types: • Direct (Walk, Bike & Auto Access) • Transfer (Transit Access)
T-BEST Model Concepts Direct Boarding Equation • s refers to stop on a route in a given direction and • n refers to time period • D = direct boardings • R = number of bus runs (arrivals) • B = vector of buffer characteristics (population/employment) • Oi = accessibility measures = characteristics of buffer areas of accessible stops, Hi, i = 2, 3, 4, 5 • X = vector of other route and stop characteristics
T-BEST Model Concepts Transfer Boarding Equation • T = transfer boardings • R = number of bus runs (arrivals) • O1 = accessibility measure = total boardings at all stops, H1, during period n toward stop s • Y = vector of other route and stop characteristics • Methodology thus includes both direct and transfer boardings equations • Accessibility vectors play major role
T-BEST Model Concepts T-BEST Data Requirements • Transit Route & Stops Location • Transit Route Schedule • Transit Route & Stop Names • Transit System • Fare Structure • Transfer Hubs • Interlined Routes
T-BEST Model Concepts T-BEST Data Requirements • Florida Source Data provided with the software: • 2000 Census data with pre-formatted SF1 and SF3 variables • 2000 InfoUSA Employment data grouped by Commercial, Industrial, and Service • 2000 GDT Street Networks • Other background GIS layers
T-BEST Analysis Model Outputs • T-BEST Calculates • Direct + Transfer = Total Boardings • Arrivals • Transfer Opportunities • Time-Period Specific Estimations • Peak • Off-Peak • Night • Aggregate Model Outputs by: • Weekday • Weekend • All Time Periods • Saturday • Sunday
T-BEST Analysis Time Period Aggregation Route 101 Inbound Stop # 10161000 Example: Model Results by Time Period
T-BEST Analysis Route Level Aggregation Outputs • Performance Measures • Boardings • Route / Service Miles • Service Hours • Boarding per Service Mile / Hour • Average Boarding per Service Run • Aggregation by: • Route Type • Technology • Report on All Routes = System-wide Analysis
T-BEST Analysis Area-Based Aggregation • Summarize Model Results with a Polygon Shapefile (Districts, TAZ, Census Blocks, etc.) • User-Defined Global Subareas • Analyze Model Output across multiple Scenarios
T-BEST Analysis T-BEST Reports • Calculates Sub-Totals by Route or Planning Area • Total for all selected inputs (stop, route, area) • Automatic Map Display Stop-level boardings (pie chart) or area distribution
T-BEST Software Comprehensive Model System • Manage Multiple Transit Systems • Scenario/Alternative Management Tools • Update Base Year Model • Internal Model Runs • Unlimited Analysis potential
T-BEST Software Transit System Management Create new Transit Systems Manage Existing Transit Systems Delete Systems All Files/Data managed internal in the software
T-BEST Software Scenario/Alternative Management Manage Alternatives Create Base Year Model Adjust Socio-Economic Variables to Future Year Incorporate Local Employment Data
T-BEST Software System Properties Fare Structure Transfer Hubs Interlined Routes Local Employment Data Socio-Economic growth applied to future year forecasts
T-BEST Software Scenario Editor Integrated editing, coding and analysis environment GIS-enabled network editing Time Period specific variables Stop-level socio-economic updates
T-BEST Software GIS Features T-BEST developed with ArcObjects Add local data or images Edit Symbols and Labels Save custom Map setup with Scenario
T-BEST Software Model Equations Edit Direct and Transfer Boarding Coeffecients
T-BEST Software Interactive Reporting Route-level Performance Measures Aggregate Records by: • Route(s) • Sub-Area • Selection Set • Planning Area
T-BEST Software Analysis Mapping Automated Map Analysis • Flexible Mapping Environment
T-BEST Software Quality Control Measures • Visualize Model Accessiblity Calculations with impedance (H1-H5) • Locate Neighboring Stops (N1 – N3) • Shortest Path Algorithm
T-BEST Software Model Engine • Time Period Specific output for each stop • Option to run for selected time-periods • Optomized model calculations to run only necessary components
T-BEST Software Additional Features • Direct conversion of T-BEST Map into ArcMap Layout • Export all Reports or lists to delimited text files • Export Map to raster or PDF • Save Sub-Areas and Selection Sets for use in multiple Scenarios • Scenario Log • Extensive User-Guide
T-BEST Implementation Default Implementation • Download & Install Software (www.tbest.org) • Default coefficients provided • Calibration for Portland, Oregon in progress • Calibration to Local Area • Local Stop Level Ridership Data • Develop Socio-Economic data • Create T-BEST Transit Network • Re-estimate and Re-calibrate
T-BEST Implementation Custom Implementation • Software • Data Model • Interface with Systems Planning and Operational Software • Scale T-BEST to your Enterprise Environment
T-BEST Implementation • Recommended Hardware • 2.0 gHZ Pentium M Processor or higher • 1 GB Ram • Required Software • Window 2000 or XP • ArcView 9.x
Conclusions • T-BEST provides a powerful framework for modeling transit ridership at stop level • Incorporates effects of accessibility and connectivity on ridership • Accessibility and impedance computations very sophisticated, accurate, and automated in software • More precisely accommodates effects of service span and frequency (temporal aspects) • Focus on ease of use and quick response capability
Future Enhancements • Enhancements for T-BEST 3.0: • Automated calibration and scaling procedures • T-BEST Analyzer • Enhance stop-level accessibility measure using alternative methodologies (e.g., network-based, regression, TLOS) • Statewide Transit Network Input
Future Enhancements • Enhancements for T-BEST 4.0: • Develop sets of equations for different urban area sizes and trip purposes • Spatial distribution of boardings to develop a stop-to-stop O-D matrix • Greater sensitivity to route type, technology type, park-n-ride facilities, and special generators
T-BEST 2.1 Demonstration