Download
1 / 17
170 likes | 261 Views
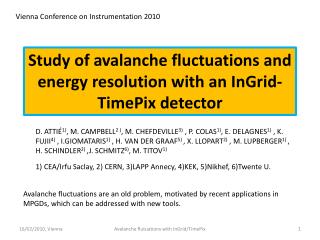
Electron Counting and Energy Resolution Study from X-ray conversion in Argon Mixtures with an InGrid-TimePix detector.

E N D
Electron Counting and Energy Resolution Study from X-ray conversion in Argon Mixtures with an InGrid-TimePix detector. D. ATTIÉ1), M. CAMPBELL2 ), M. CHEFDEVILLE3) , P. COLAS1) , E. DELAGNES1) , K. FUJII4) , Y.GIOMATARIS1) , H. VAN DER GRAAF3) , X. LLOPART2) , J. TIMMERMANS3) , J. VISSCHERS3) 1) Irfu,CEA Saclay; 2) CERN ; 3) Nikhef; 4) KEK
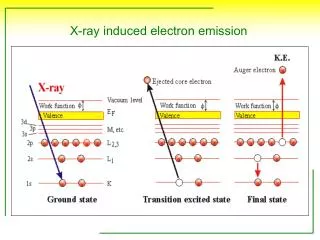
threshold Gain fluctuations An old problem : Wejsman 1949, Legler 1955, 1961, Riegler 2003,… With a renewed interest: space resolution of an MPGD tracker (gain fluctuations lower by a factor (1+q)/(2+q) the number of effective electrons, D. Arrogancia et al., accepted in NIM A) Efficiency for single-electron detection And with new means of investigation : Microbulk, InGrid + TimePix Avalanche size distribution G/<G>
Though there is no clear justification for this, we use Polya to parameterize the gain distribution. Gain fluctuations For q=0, the distribution is an exponential (Furry model) For q=1, the analytical integrations (average, efficiency) are easy Alternative convention is parameter m=1+q
TimePix Micromegas + TimePix DRIFT 55Fe DRIFT SPACE ED ~ 1 kV/cm Cr filter MICROMESH 5.9 keV Xrays giving 220 elec. in argon with rms sqrt(F/220) EA ~ 80 kV/cm READOUT InGrid (Nikhef-Twente) Micromegas detector Peak width: contribution from primary (Fano) fluctuations and gain fluctuations (assuming high detection efficiency) Sqrt((F+B)/N)
Microbulk detector KEK, january 2007 Chromium K-edge (Center for X-Ray Optics)
Result : 5.6% r.m.s. resolution (Broken record) Noise very small thanks to adequate filter on the mesh
InGrid measurements 5% rms resolution
Resolution (rms) For F=0.20 q = 2 Theta parameter
In the gain fluctuations, the avalanche statistics and the effect of the field configuration in the hole cannot be disentangled. A full simulation shows how the resolution depends on the detector geometry.
55 mm m μ 14080 m (pixel array) 55 4 4 16120 m 55 mm 2 2 3 3 1 1 5 5 55 μ m 14111 m TimePix chip Pixel Idea : take a medical imaging chip (Medipix 2), add a clock to each pixel, replace ‘grey levels’ by ‘clock ticks’ (Michael Campbell, Xavi Lloppart, CERN) 65000 pixels, 14-bit counter, 100 MHz tunable clock frequency -> more voxels than the ALEPH TPC, but tiny! Synchronization Logic Interface Configuration latches Preamp/shaper Counter THL disc.
See electrons from an X-ray conversion one by one and count them, study their fluctuations (Nikhef-Saclay)
Study efficiency vs gain SiProt on chips: spreads the charge over 2-3 pads: count clusters Use the rms size of the x-ray spot to select contained events Use the time distribution to remove noise
Timepix #1 Timepix #2 Measured spectra at -330 V 5.9 and 6.5 keV escape events (event ratio ~ 7:1) 5.9 and 6.5 keV escape events (event ratio ~ 50:1)
Peak position and grid voltage Asymptotic value of Nd gives the number of collected electrons Nc Polya fit works very well where exponential one (not shown) fails! Nc = 115 e- Nc = 102 e- • Compatible with the smaller hole diameter of InGrid #2 • Contribution from collection efficiency to peak width now known
W and F in Ar/iso 95/5 at 2.9 keV Assume full collection efficiency of detector #1 Np = Nc = 115 ± 2 e- Extrapolation to 5.9 keV photo-peak straightforward Np = 230 ± 4 e- W = 25.2 ± 0.5 eV Consistent with Pansky et al. 25.0 ± 0.6 eV Peak width measured with detector #2 corrected for detection and collection eff. (87 %) RMS(Np) ~ 4.3 % W = 25.0 ± 0.6 eV F = 0.250 ± 0.010 Ar/iso 20/80 – 1253 eV X-rays from Pansky. et al. J. Appl. Phys.79 (1996) 8892 F = 0.21 ± 0.06 Consistent with measured values and theoretical estimate 0.17 for pure Ar
Conclusions • New ‘almost perfect’ detectors give gain fluctuations wich can be parametrized by polya with q ~ 1 or 2. • Fano fluctuations are now accessible by electron counting. • Best resolution understood as sqrt((F+B)/N ), with F=0.2 and B=0.6 for Micromegas Most of the work presented here was carried out by Max Chefdeville for his PhD thesis.