Download
1 / 34
390 likes | 644 Views
Penning Traps and Strong Correlations. John Bollinger NIST-Boulder Ion Storage group

E N D
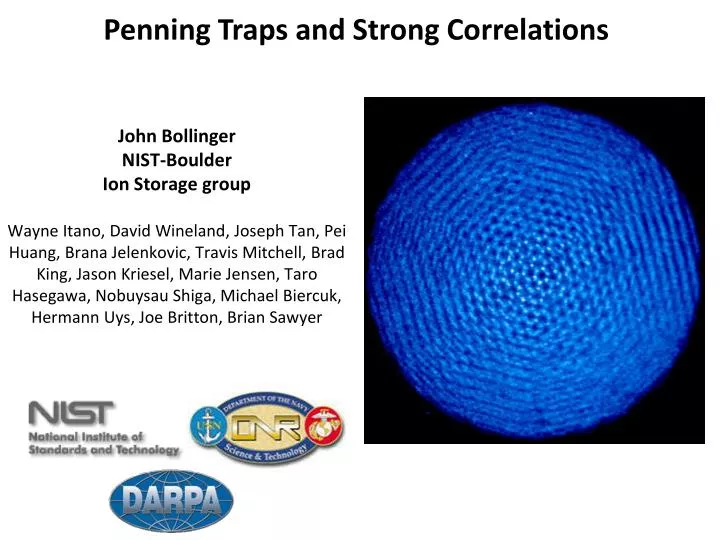
Penning Traps and Strong Correlations John Bollinger NIST-Boulder Ion Storage group Wayne Itano, David Wineland, Joseph Tan, Pei Huang, BranaJelenkovic, Travis Mitchell, Brad King, Jason Kriesel, Marie Jensen, Taro Hasegawa, Nobuysau Shiga, Michael Biercuk, Hermann Uys, Joe Britton, Brian Sawyer
Outline: • ● Review of single particle motion • ● T=0 and → constant density spheroidal equilibria characterized by N • and rotation frequency • ● Some experimental examples (NIST, Imperial College) • ● Connection with strongly coupled OCP’s • ● Types of correlations: • Shell structure • 3-d periodic crystals • 2-d crystal arrays • Experimental examples Please ask questions!! Ref: Dubin and O’Neil, Rev. Mod. Physics 71, 87 (1999)
Outline: • ● Review of single particle motion • ● T=0 and → constant density spheroidal equilibria characterized by N • and rotation frequency • ● Some experimental examples (NIST, Imperial College) • ● Connection with strongly coupled OCP’s • ● Types of correlations: • Shell structure • 3-d periodic crystals • 2-d crystal arrays • Experimental examples
Single particle motion in a Penning trap B=4.5 T characteristic trap dimension 12 cm cyclotron frequency single particle magnetron frequency 4 cm
Single particle motion in a Penning trap B=4.5 T 9Be+ Ωc/(2π)~ 7.6 MHz ωz/(2π)~ 800 kHz ωm/(2π)~ 40 kHz stability “diagram”
Single particle motion in a Penning trap B=4.5 T 9Be+ Ωc/(2π)~ 7.6 MHz ωz/(2π)~ 800 kHz ωm/(2π)~ 40 kHz Vtrap= 1 kV • Tutorial problem: • background gas collisions produce BeH+ and BeOH+ ions • What critical trap voltage will dump BeOH+ • What critical trap voltage will dump BeH+ • How much energy must be imparted to the BeH+ cyclotron motion to drive it out of the trap? 4 cm
Outline: • ● Review of single particle motion • ● T=0 and → constant density spheroidal equilibria characterized by N • and rotation frequency • ● Some experimental examples (NIST, Imperial College) • ● Connection with strongly coupled OCP’s • ● Types of correlations: • Shell structure • 3-d periodic crystals • 2-d crystal arrays • Experimental examples
Non-neutral plasmas in traps evolve into boundedthermal equilibrium states thermal equilibrium, Hamiltonian and total canonical angular momentum conserved⇒ } plasma rotates rigidly at frequency r density distribution Lorentz force potential centrifugal potential c = eB/m = cyclotron frequency plasma potential trap potential Lorentz-force potential gives radial confinement !!
T→0 limit →constant density plasma; density determined by rotation frequency
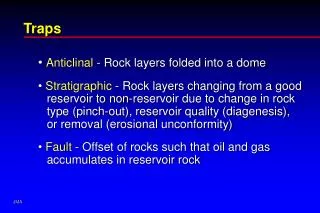
Quadratic trap potential (and T→0) plasma shape is a spheroid aspect ratio zo/ro determined by r z B 2zo r associated Legendre function r T=0 plasma state characterized by: ωz , Ωc , and ωr , N Bounded equilibrium requires: ωm< ωr < Ωc -ω 2ro
Plasma aspect ratio determined by r nB Density no wm Wc/2 Wc - wm Rotation frequency wr Simple equilibrium theory describes the plasma shapes Plasma radius→ Bollinger et al., PRA 48, 525 (1993) Rotation frequency→
Simple equilibrium theory describes spheroidal plasma shapes From Bharadia, Vogel, Segal, and Thompson, Applied Physics B (to be published) rotating wall experimental measurements of plasma aspect ratio vs trap parameters z2/2r (c - r) Measurements by X.-P. Huang, NIST = z0/r0
Outline: • ● Review of single particle motion • ● T=0 and → constant density spheroidal equilibria characterized by N • and rotation frequency • ● Some experimental examples (NIST, Imperial College) • ● Connection with strongly coupled OCP’s • ● Types of correlations: • Shell structure • 3-d periodic crystals • 2-d crystal arrays • Experimental examples
Ions in a Penning trap are an example of a one-component plasma ●one component plasma (OCP) – consists of a single species of charged particles immersed in a neutralizing background charge ●ions in a trap are an example of an OCP (Malmberg and O’Neil PRL 39, (77)) looks like neutralizing background ●thermodynamic state of an OCP determined by: > 1 ⇒ strongly coupled OCP
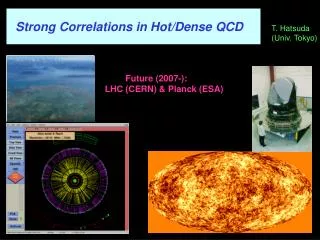
Why are strongly coupled OCP’s interesting? ● Strongly coupled OCP’s are models of dense astrophysical matter – example: outer crust of a neutron star ●For an infinite OCP, >2 liquid behavior ~173 liquid-solid phase transition to bcc lattice Brush, Salin, Teller (1966) ~125 Hansen (1973) ~155 Slatterly, Doolen, DeWitt(1980) ~168 Ichimaru; DeWitt; Dubin (87-93) ~172-174 ● Coulomb energies/ion of bulk bcc, fcc, and hcp lattices differ by < 10-4 body centered cubic hexagonal close packed face centered cubic ●with trapped ions and laser cooling, no~ 109 cm-3 T < 5 mK ⇒ > 500
Plasmas vs strongly coupled plasmas White Dwarf Interiors Neutron Star Crusts Increasing Correlation = 2 = 175 Laser-cooled ion crystals
Correlations with small plasmas – effect of the boundary shell structure Rahman and Schiffer, Structure of a One-Component Plasma in an External Field: A Molecular-Dynamics Study of Particle Arrangement in a Heavy-Ion Storage Ring, PRL 57, 1133 (1986) Dubin and O’Neil, Computer Simulation of Ion Clouds in a Penning Trap, PRL 60, 511 (1988)
Observations of shell structure ● 1987 – Coulomb clusters in Paul traps MPI Garching (Walther) NIST (Wineland) ● 1988 – shell structures in Penning traps NIST group PRL 60, 2022 (1988) ● 1992 – 1-D periodic crystals in linear Paul traps MPI Garching Nature 357, 310 (92) ● 1998 – 1-D periodic crystals with plasma diameter > 30 aWS Aarhus group PRL 81, 2878 (98) See Drewsen presentation/Jan. 16
How large must a plasma be to exhibit a bcc lattice? 1989 - Dubin, planar model PRA 40, 1140 (89) result: plasma dimensions 60 interparticle spacings required for bulk behavior N > 105 in a spherical plasma bcc lattice 2001 – Totsji, simulations, spherical plasmas, N120 k PRL 88, 125002 (2002) result: N>15 k in a spherical plasma bcc lattice
+3/2 +1/2 P3/2 9Be+ (neglecting hyperfine structure) -1/2 -3/2 no (l=313 nm) +1/2 S1/2 -1/2 NIST Penning trap – designed to look for “large” bcc crystals B=4.5 T Doppler laser cooling 12 cm Tmin(9Be+) ~ 0.5 mK Tmeasured < 1 mK 4 cm
B0 z x y Bragg scattering set-up Bragg diffraction CCD camera frotation = 240 kHz n = 7.2 x 10⁸ /cm3 deflector side-view camera -V0 9Be+ compensation electrodes(660o) J.N. Tan, et al., Phys. Rev. Lett. 72, 4198 (1995) W.M. Itano, et al., Science 279, 686 (1998) axial cooling beam
B0 z x y Bragg scattering Bragg diffraction CCD camera deflector side-view camera -V0 9Be+ compensation electrodes(660o) axial cooling beam
Bragg scattering from spherical plasmas with N~ 270 k ions Evidence for bcc crystals scattering angle
Rotating wall control of the plasma rotation frequency rotating quadrupole field (top-view) ++ ww - - - - ++ B0 z x y B0 - See Wednesday 10:15 AM talk - Bragg diffraction CCD camera strobing Huang, et al. (UCSD), PRL 78, 875 (97) Huang, et al. (NIST), PRL 80, 73 (98) deflector side-view camera -V0 9Be+ compensation electrodes(660o) axial cooling beam
Phase-locked control of the plasma rotation frequency Huang, et al., Phys. Rev. Lett. 80, 73 (98) time averaged Bragg scattering camera strobed by the rotating wall ●determine if crystal pattern due to 1 or multiple crystals ● enables real space imaging of ion crystals
B0 z x y Real space imaging gateable camera strobe signal Mitchell. et al., Science 282, 1290 (98) relay lens f/2 objective 1.2 mm deflector 1.2 mm side-view camera -V0 9Be+ compensation electrodes(660o) axial cooling beam
Top-view images in a spherical plasma of 180,000 ions B0 z x y gateable camera strobe signal r = 2120 kHz relay lens f/2 objective deflector -V0 9Be+ 0.5 mm bcc (100) plane predicted spacing: 12.5 mm measured: 12.8 ± 0.3 mm compensation electrodes(660o) bcc (111) plane predicted spacing: 14.4 mm measured: 14.6 ± 0.3 mm axial cooling beam
Summary of correlation observations in approx. spherical plasmas ● 105 observe bcc crystal structure ● > N> 2observe other crystal structures (fcc, hcp?, ..) in addition to bcc ● shell structure dominates
nB Density no wm Wc/2 Wc - wm Rotation frequency wr Real-space images with planar plasmas with planar plasmas all the ions can reside within the depth of focus
Planar structural phases can be ‘tuned’ by changing r 65.70 kHz 66.50 kHz top-views side-views 1 lattice plane, hexagonal order 2 planes, cubic order
b a Top- (a,b) and side-view (c) images of crystallized 9Be+ ions contained in a Penning trap. The energetically favored phase structure can be selected by changing the density or shape of the ion plasma. Examples of the (a) staggered rhombic and (b) hexagonal close packed phases are shown. c
Mitchell, et al., Science 282, 1290 (98) Theoretical curve from Dan Dubin, UCSD Mitchell, et al., Science 282, 1290 (98) Theoretical curve from Dan Dubin, UCSD z z3 z2 z1 x y increasing rotation frequency
Summary of Penning traps and strong correlations ●Single particle orbits characterized by 3 motional frequencies: • ●T=0 and constant density spheroidal equilibria characterized by N and rotation frequency ●Ions in a trap one-component plasma ●Large spheroidal plasmas (N > 105) stable bcc crystals metastable 3-d periodic crystals observed with 103 ions Drewsen – PRL 96(2006) Not yet observed – liquid-solid phase transition at 172 ●2-d triangular-lattice crystals obtained at low ωr (weak radial confinement) 2zo r Present effort: quantum simulation/control experiments r Biercuk et al., Nature 458, 996 (2009) Biercuk, et al., Quantum Info. and Comp. 9, 920-949 (2009) 2ro
Single particle motion in a Penning trap B=4.5 T 9Be+ Ωc/(2π)~ 7.6 MHz ωz/(2π)~ 800 kHz ωm/(2π)~ 40 kHz Vtrap= 1 kV • Tutorial problem: • background gas collisions produce BeH+ and BeOH+ ions • What critical trap voltage will dump BeOH+ • What critical trap voltage will dump BeH+ • How much energy must be imparted to the BeH+ cyclotron motion to drive it out of the trap? 4 cm