Download
1 / 2
20 likes | 141 Views
Suppl. Fig. 1. A. B. C. 1600. Pre-treatment. vehicle. 10000. vehicle. 24 hr. 1400. 800. Dulanermin 60 mg/kg. Dulanermin 60 mg/kg. 48 hr. 1200. 8000. 600. 1000. 6000. Luminescence (RLU). M30 antigen (U/L). Mean tumor vol (mm 3 ). 800. 400. 600. 4000. 400. 200. 2000.

E N D
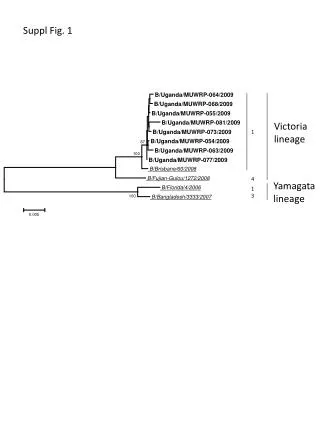
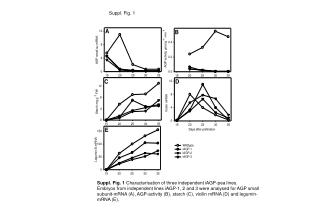
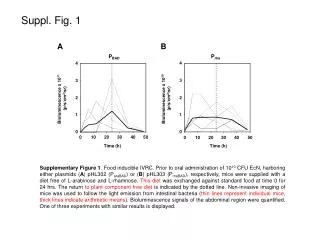
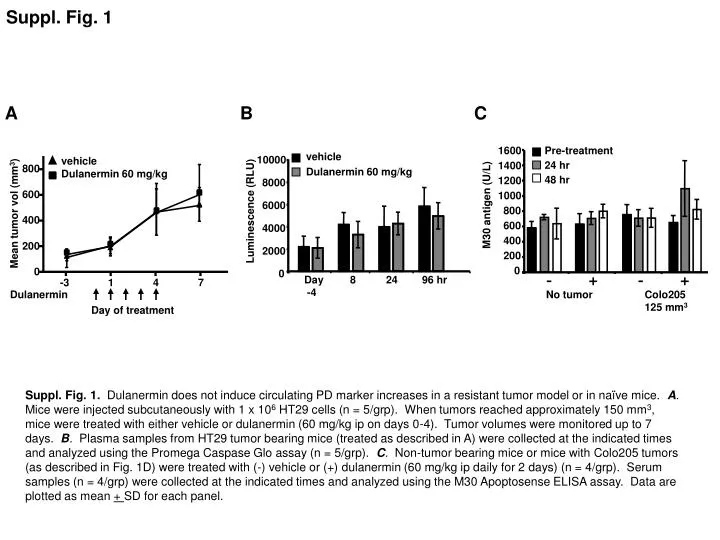
Suppl. Fig. 1 A B C 1600 Pre-treatment vehicle 10000 vehicle 24 hr 1400 800 Dulanermin 60 mg/kg Dulanermin 60 mg/kg 48 hr 1200 8000 600 1000 6000 Luminescence (RLU) M30 antigen (U/L) Mean tumor vol (mm3) 800 400 600 4000 400 200 2000 200 0 0 0 Day -4 8 24 96 hr - + - + -3 1 4 7 No tumor Colo205 125 mm3 Dulanermin Day of treatment Suppl. Fig. 1. Dulanermin does not induce circulating PD marker increases in a resistant tumor model or in naïve mice. A. Mice were injected subcutaneously with 1 x 10⁶ HT29 cells (n = 5/grp). When tumors reached approximately 150 mm3, mice were treated with either vehicle or dulanermin (60 mg/kg ip on days 0-4). Tumor volumes were monitored up to 7 days. B. Plasma samples from HT29 tumor bearing mice (treated as described in A) were collected at the indicated times and analyzed using the Promega Caspase Glo assay (n = 5/grp). C. Non-tumor bearing mice or mice with Colo205 tumors (as described in Fig. 1D) were treated with (-) vehicle or (+) dulanermin (60 mg/kg ip daily for 2 days) (n = 4/grp). Serum samples (n = 4/grp) were collected at the indicated times and analyzed using the M30 Apoptosense ELISA assay. Data are plotted as mean + SD for each panel.
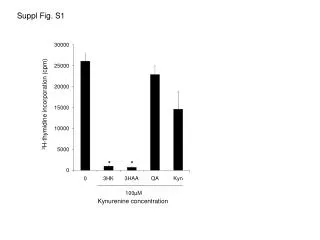
Suppl. Table 1 Suppl. Table 1. Analysis of intra-patient variation using the caspase 3/7 activity assay. Three blood draws were collected sequentially from 6 healthy volunteers at four possible timepoints (0, 24, 48, 168 hr). Mean serum caspase 3/7 levels and the variation coefficient were calculated for each individual donor.