Download
1 / 20
200 likes | 269 Views
iNZight Insights in the beginning…. Whangarei PD Day May 6 th 2013 Jim Hogan. My Goals Today. Have you gain confidence to explore this software Make you aware of where to find resources Help you appreciate when to use iNZight Become an iNZight user

E N D
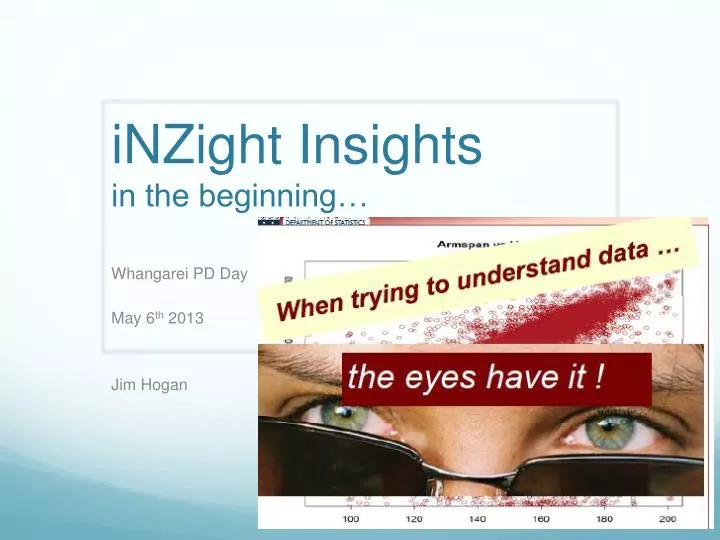
iNZight Insightsin the beginning… Whangarei PD Day May 6th 2013 Jim Hogan
My Goals Today • Have you gain confidence to explore this software • Make you aware of where to find resources • Help you appreciate when to use iNZight • Become an iNZightuser • Have fun being a learner again. What are your goals?
Plan of Nec Slides • Downloading and installing on Mac or PC • Basic history, ownership and use • Starting it up • Data and variables • Graphs (dots, bars and boxes) • PPDAC and Inference • Discussion of when to use (and when not to use) • PPDAC and “on the second day…”
Downloading and Installing • Download http://www.stat.auckland.ac.nz/~wild/iNZight/, unzip and notice where you put it all. • To begin find the “START_INZIGHT.command” • Double click the ICON and way we go • Investigate this website!
iNZight History… • iNZighthas been primarily supported by The University of Auckland, Department of Statistics • with additional support from Statistics New Zealand and the NZ Ministry of Education via Census at School NZwebsite • Useless info…it is written in R, which is a subset of S a global used computer language for statistics. oh…
…designed for our schools • Initially designed for New Zealand high schools, iNZight now extends to multivariable graphics, time series and linear models. • A simple data analysis system which encourages exploring what data is saying without the distractions of driving complex software
Getting data • I suggest that you import .csv files • After • “conditioning” the data in Excel • Taking a sample • Getting rid of nonsense • Tidying and ordering • And so on. • Develop a system that works for you… .csv
Making a .csv file • In Excel select the file type you want.
Data and Variables • Categorical data are things like words. One does not add words. Telephone numbers are categorical data. The sum of two telephone numbers does not mean a lot. • Numerical data can be added and multiplied. Numerical data can be converted to categorical data. Why might we do this?
Dot Plots and Boxes • Rather easy to make • Drag some numerical data into the variable.
Bar graph • Drag some categorical data into the variable
PPDAC • Ask a sensible question • “I wonder if the weight of female trout in the Lake Taupo 1993 are heavier than the males?” • Why would I want to know this? Hmmmm…
ppdAc • We see…
ppdaC • And by any measure, especially the eyes, the answer is …
Conclusion • The female trout in the 1993 Lake Taupo are not heavier than the males. • The answer is not NO • The answer is not that there is no difference • The answer is not the males are heavier • ATFQ • The answer is as above.
A better question? • I wonder if the trout caught by FF are bigger than the trout caught by any other method. • Reason…I want to catch a big trout • Task, you answer this.
When to use iNZight • Discussion time…
When to use iNZight… • My view is • not before students are ready • that means • when they tell you how to • draw a dot plot and bar graph • draw a box and whisker and tell you everything about it • not before and can describe distributions using their eyes. REASON ----------------
Reason • ReasonThis is very powerful software and they will take the short cut and use it before understanding what it all means. So if you want to create a rod for your own back then show them how to use it. • Year 7/8 – never • Year 9/10 – only when they are multiplicative, know fractions and can explain that 25% of the data is in each of box parts. What min, LQ, med, UQ, IQR, max all mean. • Year 11 – Use deeply. Use any time as a teaching tool for visual stuff.
Let’s play and discover more questions • Hands on, get dirty! • Are there two species of dolphins in NZ waters? • What is your best approach to catching a big trout? • Time series?