Download
1 / 42
420 likes | 554 Views
Conservation Action Planning Process. Target Viability/Integrity: An Iterative Process. What is Viability?. What is “viability”?. Viability of a conservation target is the measure to which the target is…….

E N D
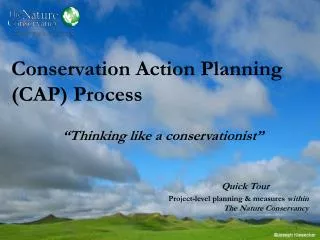
Conservation Action Planning Process Target Viability/Integrity: An Iterative Process
What is Viability? What is “viability”? Viability of a conservation target is the measure to which the target is……. resistant to change in its structure and composition in the face of external stresses and resilient – able to recover upon experiencing occasional severe stress
Why Assess Viability? • Toclearly define targets (esp. ecological systems) • Science-based foundation for establishing current statusof a target and setting desired future condition(goals) • Helps to identify stressesto the ecological integrity of each target and understand with more precision how these threats disrupt the target • Assists in developing good objectives and focused strategies • Guides the design of monitoringprotocoland measures of success • Helpsidentify critical knowledge gaps about the system
Viability analysis has three steps Step One. Define Key Ecological Attributes Step two. Identify indicators of status of these Attributes Step three. Rank the indicators
Step One Select: KEY ECOLOGICAL ATTRIBUTES Aspects of the conservation target (species, community or ecological system) that clearly define or characterize the target and determine its distribution and variation over space and time. Characteristics of the target, that if eliminated or significantly altered, would result in the demise of the target or would shift it into something quite different.
Characteristics of Conservation Targets –assigned to categories of…… Size • Area or abundance • Minimum dynamic area Condition • Composition (e.g., native vs. nonnative) • Structure (e.g., age) • Biotic Interactions (e.g., reproduction) Landscape Context • Dominant environmental regimes (e.g.fire, hydrology) • Connectivity (e.g., access to habitats/resources, ability to disperse, migrate, re-colonize)
Tips for Selecting Key Ecological Attributes • Pick factors that are critical for long-term viability… Characteristics, if degraded, would seriously jeopardize the target’s ability to persist for 100+ years? • When in doubt, pick characteristics that can be or are likely to be affected by human activities • Look for a few really key ecological attributes … versus many desirable or descriptive characteristics Key Ecological Attributes are what’s important…….
Second Step: Select Indicators Indicators are measurable aspects of the Key Ecological Attribute that inform us of its status or “health” Key Attribute: Circulatory system Indicator: Blood pressure Indicators are what you measure
Look for indicators that ... • Strongly relate to the status of the key ecological attribute • Are efficient & affordable to measure • Where you can reasonably define what constitutes “Good” • Desirable indicators ... • Might provide an early warning to serious stresses • Might assess two or more key ecological attributes e.g. Presence of young cypress in a floodplain forest as an indicator for both hydrological regime & reproduction of dominant species
Step Three: “Ranking” Target Viability Very Good: Ecologically desirable status; Requires little intervention for maintenance Good: Indicator w/in acceptable range of variation; Some intervention required for maintenance Poor: Restoration increasingly difficult; May result in extirpation Fair: Outside acceptable range of variation; Requires human intervention
SIZE CONDITION SIZE CONDITION LANDSCAPE CONTEXT LANDSCAPE CONTEXT Biodiversity Health or Landscape Functionality Overall “Picture” of Project Viability Target A Viability Target B Viability Target C Viability Target D Viability
Conducting the Assessment • Begin with a “credible first iteration” -- your first approximation • Identify 3 - 5 really key ecological attributes for each focal target (maybe one each for size, condition and landscape context) • Determine what you’ll measure for each attribute – indicator • Discuss and describe what would constitute a “good” status • Rate the “Current Status” for each attribute, based on informed expert opinion + available information • Present your initial findings to colleagues/experts for review An iterative process with “successive approximations”
Example - 1st Pass • Grassland focal target identified • Fire regime = Key Attribute (Landscape Context) • Fire frequency = Indicator • Dense woody cover suggests not enough fire • Current status deemed not viable - assigned “Fair” Fair Grassland Target Fire regime Fire frequency
1st Pass - table 1st pass results in Indicator Rating table
2nd Pass Phone call to local grassland expert indicates natural fire frequency of 5-10 years.
3rd Pass • % of the area that is burned at acceptable frequency deemed important • Decision made > 50% of area = viable or key attribute = “Good” • Current status is < 50% is burned at this interval
Flexible level of detail 1 2 3 The project team could have settled on any one of these 3 alternatives as part of their initial CAP plan
Incomplete is OK! How important is it to fill out all ratings in this case where Current & Desired status is Very Good? • Probably Not Important! • Unless grassland area is threatened by large-scale habitat destruction. • In this case, determining the Fair rating might guide efforts to determine how much to save
Accept uncertainty! General Guidance • View main purpose as capturing the current state of knowledge • Don’t worry about information gaps • Don’t focus on filling out all indicator ratings • Can return during later planning stages to add more detail (if necessary)
A Reasonable First Pass Example Target: Black-billed and Yellow-billed Parrots – Cockpit Country
Breakout Group Instructions: Viability Assessment Task • Select one target from your project area. • Develop 3 - 5 key ecological attributes • Identify one indicator for each key ecological attribute • Develop indicator rating criteria for one indicator (based on your collective expert opinion) • Define “good” and the current status • Qualitative ratings are OK! (e.g. “Lots of in-stream barriers”, “not enough fire” etc.)
Breakout Group Instructions: Viability Assessment Very Briefly Report Back: • What are the key attributes you selected? • Why is each attribute “key” for the target? • Which key ecological attributes did you select indicators for? • What indicators were selected? • Which indicator did you develop rating criteria for? • How confident are you in your rating?
What follows are a set of additional examples you might want to substitute in the presentation for your use. Or you might want to use an example from a previous project you have worked on.
Example - 1st Pass Population size & dynamics Fair Diadromous fish Size # of adult (silver) eel harvested • American eel focal target identified • Population size & dynamics = Key Attribute (size) • Number of adult (silver) eel harvested = Indicator • Few mature (silver) eels caught by fisherman during out-migration. • Current status deemed not viable - assigned “Fair”
1st Pass - table 1st pass results within Indicator Rating table
2nd Pass Conversation with local eel expert indicates silver eel harvest used cover the bottom of weirs with eels, approx 1,000 lbs a night.
3rd Pass • % of fish biomass deemed to be important • Decision made > 35% biomass = viable KEA = “Good”
Indicator RatingsBold=CurrentItalics=Desired FocalTarget Category Key Attribute Indicator Poor Fair Good Very Good Diadromous fish Size Population size & dynamics # of adult (silver) eel harvested No eels caught during out-migration Few mature eels caught during out-migration 1 Diadromous fish Size Population size & dynamics # of adult (silver) eels harvested/night < 1,000 lbs/night >1,000 lbs/night 2 Diadromous fish Size Population size & dynamics % fish biomass < 25% 25 – 35% 35 – 50% > 50% 3 Flexible level of detail The project team could have settled on any one of these 3 alternatives as part of their initial CAP plan
From Viability assessment in Indonesian village Population size Fish catch per day X Size • Catches from the Sea identified as a focal target for fish caught for local consumption and sale • Key attribute & indicator selected • Fisherman observe that catch is much less than they remember in recent times • Current status considered not viable (Fair)
From Viability assessment in Indonesian village 31-100 strings of fish > 100 strings of fish • Interviews indicate current harvest < 30 strings of fish • Ten years ago, harvest yielded up to 200 strings of fish • > 100 considered Very Good • 31-100 considered Good
Size/Minimum Dynamic Area Acres (000’s)
Viability Assessment: Fundamentals • Key Ecological Attributes • Critical component of target’s life history, physical or biological processes, composition, structure • Clearly define target • Limit its distribution • Determine its natural variation over space and time • On a time scale of 50-100+years • Viability Indicators • Measurable entities used to assess the status of Key Ecological Attribute(s). • Indicator Rating Categories • Criteria to enable objective status assessments