Download
1 / 8
80 likes | 193 Views
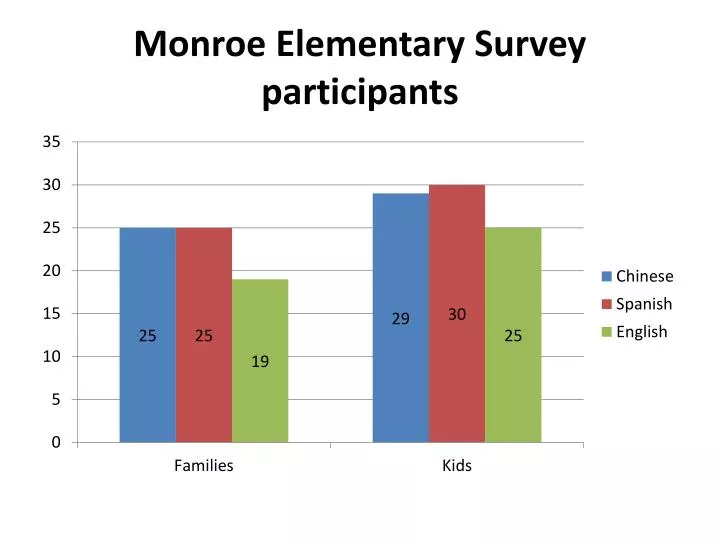
Monroe Elementary Survey participants. Hoover vs. Choice N= 68 families. Families with a car N = 32. Families w ith No car (N = 38). Bus makes Hoover okay. Families Who Want Choice Number of Families With and Without Cars by Language. Spanish 2. Chinese 3. English 9. Spanish 7.

E N D
Families with a car N = 32 Families with No car (N = 38) Bus makes Hoover okay Families Who Want Choice Number of Families With and Without Cars by Language Spanish 2 Chinese 3 English 9 Spanish 7 Chinese 2 English 2 Spanish 7 English 1 Chinese 1 English 6 Spanish 8 Chinese 0 Bus does not make Hoover okay Home Language of kids per grade: (N= 32) Home Language of Families with multiple kids per grade (N = 10)
Families Who Want HooverNumber of Families With and Without Cars by Language Families with a Car Families with No Car Bus would make Hoover okay English 1 Chinese 2 Spanish 1 English 2 Chinese 17 Spanish 1 Spanish 0 English 1 Chinese 1 Chinese 1 Spanish 2 English 0 Bus does not make a difference Home Language by number of kids per grade (N = 31) Home Language of Families with multiple kids per grade (N = 5)
Language Spoken by Family (Car ownership, younger siblings at Monroe, Hoover vs. Choice)
Summary • More Families prefer Choice of Middle School to being fed to Hoover, with the Chinese families preferring Hoover, and a majority of English and Spanish-speaking families preferring Choice. • Most Spanish and English speaking families prefer Choice whether or not they have a car. • Most Chinese speaking families prefer Hoover whether or not they have a car. • Most families who have more than one sibling (younger one still at Monroe) want a choice of where to send their kids to middle school. • Most families who live in the furthest zip codes (more than a 30-minute drive from Hoover) prefer choice. • Most families who live more than a 20-minute drive from Hoover want a bus. • About 1/3 of those who prefer Choice would be okay with Hoover if there were a bus. • Very few of the families who live in the 94112 zip code (<%5) have cars. • Most families in the 94112 zip code want a bus to Hoover regardless of language, program, or preference for Hoover or choice.
Conclusions • Monroe families are split along language lines as to whether we want Hoover or Choice for Middle School • A large percentage will need a bus because either: • They do not have a car • They have younger siblings at Monroe and it is a hardship to transport both children to school • Start time for immersion programs are very early in the morning • Other potential needs: • After School Programs • Clarification around what happens if families don’t put Hoover first, and if this leads to the risk of being placed in other schools not on their list of choices • Clarification around elective options and how they will be preserved