Download
1 / 42
420 likes | 600 Views
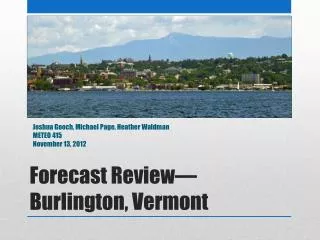
Update on NCHRP Study Topic 20-07/Task 274 Price Indexing in Transportation Construction Contracts Jonathan Skolnik, Vice President, Jack Faucett Associates, Inc. American Association of State Highway Transportation Officials Subcommittee on Construction Meeting Burlington, Vermont

E N D
Update on NCHRP Study Topic 20-07/Task 274Price Indexing in Transportation Construction ContractsJonathan Skolnik, Vice President, Jack Faucett Associates, Inc. American Association of State Highway Transportation Officials Subcommittee on Construction Meeting Burlington, Vermont August 15 – 20, 2010 Contract Administration Session, Adirondack A/B Salons, 9:45 a.m.
Agenda • I – Objectives of the Presentation/Objectives of the Research • II – Overview of Tasks and Accomplishments • III – Phase I (Tasks 1-5) Results • IV – Phase II (Tasks 6-9) Issues and Progress • V – Project Schedule • VI – Input/Discussion
I – Objectives of the Presentation • Inform attendees as to the progress of the study • Describe the objectives of the research • Describe the research methodology and work plan • Present the results of Phase I which included surveys and statistical analysis • Describe the ongoing work to delineate the risks and benefits of price adjustment clauses • Discuss the economic concepts and public policy issues • Gather input and suggestions
I – Objectives of the Research • Describe the current state of DOT practice in using price indexing or cost escalation clauses in construction contracts • Collect data on the experience with escalation clauses from state DOTs, highway construction contractors and others • Conduct a quantitative analysis of the effectiveness of the clauses using highway construction bid item data • Describe the economic theory behind cost escalation clauses and the benefits and risks of such policies • Provide guidance for DOT staff making decisions about whether and how they should use such clauses.
II – Tasks and Accomplishments Overview • Task 1: Kick-off Meeting - Discuss the research and document results. • Task 2: Review of State DOT Experience - Review the experience of state DOTs that have used clauses as part of their construction contracts. • Task 3: Review of Construction Industry Experience - Gather information on indexing and cost escalation from industry. • Task 4: Assess Impacts - Compile a database and to perform statistical analysis to examine whether these clauses have a measurable effect on bid prices and the number of bids. • Task 5: Technical Memorandum of Current Practices - Prepare technical memorandum, describing the results of Tasks 2, 3, and 4. • Task 6: Interim Progress and Findings Meeting - Convey the results of the first phase of the research to the NCHRP project panel in order to demonstrate progress and allow feedback. • Task 7: Assess Benefits and Risks - Assess the net benefits and the risks of price indexing or cost escalation clauses. • Task 8: Develop Guidelines - Develop explicit guidelines DOTs may use to determine when conditions warrant the use of price adjustment clauses. • Task 9: Develop Final Report - Prepare a draft and final report documenting all project work.
II – Tasks and Accomplishments A. Task 1 – Kick-off Meeting • A kick-off meeting was held between panel members, JFA and Oman Systems, Inc. on September 17, 2009. • The meeting discussed the research work plan, sources of information, anticipated research results, commodities, and bid items that may be the primary focus for investigation, and general comments and concerns. • JFA delivered the technical memorandum (TM1), a summary of the kick-off meeting, on September 28, 2009.
II – Tasks and Accomplishments B. Task 2 – Current Practice: State DOTs • JFA and Oman Systems, Inc. drafted the survey and provided a copy to NCHRP panel members on October 16, 2009. • The panel’s comments and revisions were added to the final survey, which was administered online via Survey Monkey on November 20, 2009. A total of 30 responses were collected from the initial online solicitation. • A follow up email elicited an additional five responses. • The draft Task 2 Report (Chapter 1), analyzing 35 state DOTs, was handed in on December 21, 2009. • The remaining 15 states were collected after individual phone calls were made to each DOT. Chapter 1 was updated for Task 5 (TM2) to reflect this 100 percent response rate. In addition, all panel comments from the draft Chapter 1 were added to the Task 5 draft report.
II – Tasks and Accomplishments C. Task 3 – Current Practice: Contractors • JFA and Oman Systems, Inc. drafted the survey and provided a copy to NCHRP panel members on December 1, 2009. • The panel’s comments and revisions were added to the final survey, which was administered online via Survey Monkey on January 18, 2010. • A total of 400 contractors were selected for the survey based on a random sample of bids to ensure a representative sample of contractors. • The initial online solicitation collected 39 responses. Three follow-up emails garnered an additional 13 responses. The draft Task 3 Report (Chapter 2) analyzed 52 contractors and was delivered on February 12, 2010. • Based on panel concerns about response rates, phone calls were made to every contractor that did not respond. This effort brought the contractor total to 100, a 25 percent response rate. Chapter 2 was updated for Task 5 (TM2) to reflect the doubled response rate as well as panel comments from the draft Chapter 2.
II – Tasks and Accomplishments D. Task 4 – Statistical Analysis of Impacts • JFA and Oman Systems, Inc. developed the bids database and obtained specific state indexes for the statistical analysis. This analysis used Oman System’s comprehensive Bid Price database, which contains bid prices by item and project for 48 states. • The study team’s statistician performed multiple statistical analyses: • Time series plots of bid prices for specified pay items • Scatter plots mapping relationships between bid prices and quantities • Weighted and un-weighted means and standard deviations of low bids • Month-to-month and three-month moving average of price index percent changes • Bid price regressions for all dates, periods of falling prices, periods of rising prices; independent variables include price, quantity, PAC, opt-in and trigger value • Regressions run on group of PAC states versus group of non-PAC states • Regressions run on individual PAC states versus group of non-PAC states • Same set of regressions run for number of bids on a project • A total of 30 regressions were performed for the statistical analysis
II – Tasks and Accomplishments E. Task 5 – Technical Memorandum II • The previous task reports were combined and an additional conclusions section was added to create an overall preliminary report that describes current practices, perceived effectiveness, administrative cost, and statistical analysis of the effectiveness of the clauses. • The Task 5 technical memorandum (TM2) was delivered March 18, 2010. • A sampling of the results presented in that report are provided in Part III of this presentation.
II – Tasks and AccomplishmentsF. Task 6 – Task 6: Interim Progress & Findings Meeting • Conveyed the results of the first phase of the research to the NCHRP project panel in order to demonstrate progress and allow feedback. • The project team documented key conclusions and decisions from this discussion in a brief technical memorandum (TM3). The team delivered TM3 for NCHRP review on April 19, 2010 and revised TM3 as necessary to respond to NCHRP comments. • Key issues were the complexity of the statistical analysis for many readers, the disagreement between survey results and the statistical MNNALYSIS and format of the report especially placement of the guidelines and the statistical analysis.
II – Tasks and Accomplishments G. Task 7 – Assess Benefits and Risks • The purpose of this task was to assess the net benefits and the risks of price adjustment clauses. • In conducting this task, the project team considered all of the quantitative and qualitative information collected in previous tasks. The project team combined this information with the underlying economic theory that underpins the use of price adjustment clauses. • The Task 7 Report was delivered on July 2, 2010.
II – Tasks and Accomplishments H. Task 8 – Develop Guidelines • The purpose of this task was to develop explicit guidelines DOTs may use to determine when conditions may warrant the use of price indexing or cost escalation clauses. • The guidelines describe the key factors DOTs should consider and the decision-making process an agency might use. The guidelines will also describe each of the attributes of these clauses and provide guidance as to where and when each attribute is effective and at what level to set them. • The work effort on this task will began in July and the project team will deliver the Task 8 report mid-August, 2010.
II – Tasks and Accomplishments I. Task 9 – Develop Draft and Final Reports • In this task, the project team will prepare a final report documenting all work in the project. This task will benefit significantly from all of the task reports and memorandums. The final report will incorporate information presented in all task reports, technical memoranda and NCHRP comments on these memoranda. • The project team will submit the draft final report in electronic format for NCHRP review within 12 calendar months of the Task 1 teleconference, or approximately mid September, 2010. • Upon receipt of panel comments, the project team will revise the draft as necessary to respond to NCHRP panel comments and submit the revised report. The revised final report is schedule for delivery on November 1, 2010.
III – Phase I Results A. Current PAC Program Practices Program Design • A total of 47 out of 50 states use a price adjustment clause (PAC). Fuel (41); Liquid Asphalt (40); Steel (15); Asphalt Mix (4). DOT PAC Distribution • Trigger point are most often set between 5 and 7.5 percent. • Asphalt PAC trigger points are lower than those used for fuel PACs. • Three quarters of the responding states reported that they the use fuel use per unit method to calculate fuel usage and PAC payments.
III – Phase I Results A. Current PAC Program Practices PAC Size Relative to Total Highway Disbursement Program Size • With the exception of South Carolina, average PAC payments from 2006 to 2009 represent less than 1.5 percent of each state’s direct highway spending. • Average DOT payments exceed their returns by approximately four times ($58 million to $14 million). However, with falling fuel prices in 2009, reporting states actually had returns that exceeded payments.
III – Phase I Results A. Current PAC Program Practices Program Costs • Administrative burden is the most highly cited barrier by DOTs to implementing/using PACs. • Average number of person-hours spent administering PACs : • DOTs – 86 hours/month, 1,000 hours/year • Contractors – 10 hours/month, 120 hours/year • Estimated total administrative costs including hours spent, subscriptions, initial and recurring costs: • DOTs – $5 million • Contractors – $15 million • Total administrative costs as a percentage of total average annual PAC program disbursements is 4 percent.
III – Phase I Results B. PAC Program Benefits Lower Bid Prices • Among DOTs, 78 percent reported receiving moderate/large benefit from PACs in terms of better pricing, 4 percent reported no benefits. Among contractors, 58 percent reported submitting moderately/significantly lower bid prices with PACs, 13 percent reported moderately/significantly higher bid prices. Bid Price Behavior in Contracts without PACs • Approximately 91 percent of contractors reported adding contingencies to bid prices when there is no PAC. • Statistical analysis does not conclusively prove that states with PACs benefit from lower prices. In some single state model cases (e.g. Missouri), there is evidence that the PAC program leads to lower bid prices.
III – Phase I Results B. PAC Program Benefits Increased Number of Bids • Small perceived change in the number of bids resulting from PAC presence: • DOTs – 24 percent moderate/large benefit, 40 percent small benefit, 35 percent no benefit • Contractors – 30 percent moderately/significantly higher number of bids, 60 percent no change, 6 percent moderate/significantly lower number of bids DOT Perceived PAC Affect • Statistical analysis does not provide evidence that PAC programs increase the number of bidders. This may be difficult to measure as firms bid more during economic downturns, which correlate with material and fuel price increases.
III – Phase I Results B. PAC Program Benefits Contractor Perceived PAC Affect Market Stability • A total of 60 to 80 percent of responding DOTs perceive a moderate/large benefit from PACs to all stakeholders in the market – DOTs, prime contractors, subcontractors and suppliers. Less than 7 percent of DOTs perceive no benefit to themselves, prime or subcontractors. • The majority of responding contractors • believe the levels of risk to suppliers • and prime/subcontractors are • moderately/significantly lower, whereas • only between 12 to 16 percent believe • levels of risk are higher. • A total of 58 percent of responding contractors believe overall market stability is moderately/significantly higher with PAC presence, 6 percent believe stability is lower.
III – Phase I Results B. PAC Program Benefits Supply Chain Benefits and Risks • Obtaining fixed prices from suppliers on contracts without PACs is a major problem for most contractors – 73 percent indicate it as either a moderate or a major problem, only 27 percent indicate it as slight problem or none at all. • Most contractors believe suppliers honoring price and quantity commitments on contracts without PACs is a significant issue – 61 percent indicate as either a moderate or a major problem, 25 percent a slight problem and 14 percent a non-issue. • The issue of costs for carrying inventory when contracts lack a PAC is less agreed upon with 43 percent of contractors indicating this issue as either a moderate or a major problem, 32 percent a slight problem and 25 percent a non-issue. • When asked whether supplier price relationships change with the introduction of a PAC program, the majority of contractors state “no.”
III – Phase I Results C. PAC Program Design Alternative Program Designs • The fuel use per unit method is the most used and preferred method for fuel price adjustment. The majority of DOTsand contractors believe that updated fuel usage factors and additional fuel usage factors for this method will improve fuel PACs. • Contractors generally do not have problems or issues related to program design for contracts withPACs: • Invoice timing vs. index payment calculations – 86 percent no/slight problem • High trigger values – 75 percent no/slight problem • Incorrect index values – 78 percent no/slight problem • Material price risk – 77 percent no/slight problem (as opposed to 68 percent moderate/major problem for contracts without PACs)
III – Phase I Results C. PAC Program Design Barriers to Implementation • In addition to the administrative costs detailed previously in “Program Costs,” DOTs perceive the following barriers to implementing or usingPAC Programs: creating policy within the DOT, contractor resistance to PACs and the availability of fuel usage factors. DOT Perceived Barriers
III – Phase I Results C. PAC Program Design Future PAC Program Plans • A total of 12 of the 27 responding DOTs plan to add items. • Fuel and liquid asphalt are largely indexed currently and therefore few DOTs plan to add them. The proportion of states that plan to add steel and cement is relatively large when compared to the number of states that currently index them. • Contractor item preferences are similar to DOT plans – many contractors are subject to fuel and liquid asphalt and therefore not as many would like them added. Many contractors would like cement and steel added. • Unlike the small number of DOTs planning to add concrete and asphalt mix, a large number of contractors would like them added. • Between 60 and 75 percent of DOTs and contractors would like updated fuel usage factors and additional fuel usage factors for the fuel use per unit method.
IV – Phase II Issues and ProgressA. Price Adjustment Clauses as a Policy • The purpose of Phase II is to provide policy guidance based on the research • Why are price adjustment clauses needed? • What can economic theory tell us about price adjustment clauses? • What are the benefits and risks of price adjustment clauses? • What guidance can we provide to agencies?
IV – Phase II Issues and Progress B. Input Prices and Construction Costs • Prices for gasoline, diesel and asphalt cement have fluctuated rapidly Source: ACAF, Asphalt Contractor’s Association of Florida, 2008, http://www.dot.state.fl.us/Construction/fuel&bit/fuel&bit.htm#2004%20Fuel&Bit
IV – Phase II Issues and Progress B. Input Prices and Construction Costs • Construction Cost Indices have escalated • Indices increased at an accelerated rate from 2003-2009 Source: http://www.wsdot.wa.gov/biz/construction/CostIndex/CostIndexPdf/CostIndexGraph.pdf
IV – Phase II Issues and Progress B. Input Prices and Construction Costs • Current and Constant Dollar Receipts for Highways ($, Billion) depicts how receipts for highways have eroded in real terms in recent years • In 2002 dollars, receipts have dropped from approximately $140 billion to just under $120 billion in 2008, representing only 83.4% of 2002 purchasing power.
FHWA/TX-08/0-6011-1, URL: http://tti.tamu.edu/documents/0-6011-1.pdf IV – Phase II Issues and Progress B. Input Prices and Construction Costs • Facing this dilemma of construction costs that are rising more rapidly than budgets, the transportation community has examined strategies and techniques to control costs. • A TTI study ranked of the 21 methods having programmatic or program-wide applications, with price adjustment clauses ranking eighth FHWA/TX-08/0-6011-1, URL: http://tti.tamu.edu/documents/0-6011-1.pdf
IV – Phase II Issues and ProgressC. Economic Theory • “Among the faithful, the market structure of perfect competition requires five necessary assumptions: (1) Firms sell a homogeneous product; (2) There are a large number of small firms; (3) Firms are price takers; (4) There are no barriers to entry and exit in the long-run; and (5) Firms and consumers have perfect information.” Scott A. Beaulier and Wm. Stewart Mounts, Jr. Stetson School of Business and Economics, Mercer University “Asymmetric Information about Perfect Competition: The Treatment of Perfect Information in Introductory Economics Textbooks”
IV – Phase II Issues and ProgressC. Economic Theory • “Perfect Competition requires that consumers, firms, and resource owners have perfect knowledge of the relevant economic and technological data. Consumers must be aware of all prices. Laborers and owners of capital must be aware of how much their resources will bring in all possible uses. Firms must know the prices of all inputs and the characteristics of all relevant technologies. Moreover, in its purest sense, perfect competition requires that all of these economic decision-making units have an accurate knowledge of the future together with the past and present.” Edwin Mansfield Ph.D., University of Pennsylvania Microeconomics Theory and Practice, 2nd Edition, 1975
IV – Phase II Issues and ProgressC. Economic Theory • “Improved technology affects the returns to production in another important way. Not only does it help stabilize prices at a lower level by increasing production, it reduces the proportion of inputs contributed by the (producer). Increased technology inputs in the production process reduces the amount of (producer) owned and supplied inputs. As a producer’s share of labor and other inputs decline, so does their share of the earnings. The profit earned (economic rent) is returned to the provider of the input. Thus, profit margins are narrowed and the importance of controlling the risk associated with the other inputs is enhanced.” Dr. Laurence Crane, National Crop Insurance Services “Production Risks: Alive and Well”
IV – Phase II Issues and ProgressC. Economic Theory • “Because the BAF (Bunker Fuel Adjustment Factor) is a mechanism for shifting the risk of fuel price volatility, the decision should be explicitly made as to how much of the risk each party should bear.” • “If a carrier is better placed to manage this risk, through hedging or other means, then it should bear more of the risk.” • “If carriers are in the best position to forecast risk and take appropriate actions to minimize the impacts, then they should bear the risk directly.” • “If the risk is largely out of anyone's control (or any of the relevant parties), and shippers (USTRANSCOM) can absorb the uncertainty of not knowing actual costs until the time of delivery, then shippers can bear the risk. U. S. Department of Transportation, Volpe National Transportation Systems Center “Calculation of Bunker Fuel, Currency, and Inland Freight Fuel Price Adjustment Factors for USTRANSCOM Commercial Shipping Contracts”
IV – Phase II Issues and ProgressC. Economic Theory • Transaction-Cost Economics - “A small literature has developed that explains various forms of organization that depart from repeated auction-market transactions between individual buyers and sellers as efficient responses to this “hold-up” problem rather than as monopolistic behavior … the hypothesis that long-term contracting is a means of approximating efficiency in an environment of small-numbers bargaining, uncertainty, and immobile capital is difficult to reject because the transactions cost model is often quite general and not formalized.” Glenn Hubbard, Columbia University Robert J. Wiener, Brandeis University Efficient Contracting And Market Power: Evidence From The US Natural Gas Industry, J. of Law and Economics, (1991)
IV – Phase II Issues and Progress C. Economic Theory • “Economists do not know very much. Other people, including the politicians who make economic policy, know even less about economics than economists do.” Herbert Stein Ph.D., University of Chicago Chairman, President’s Council of Economic Advisors (1969-74)
IV – Phase II Issues and ProgressD. Benefits and Risks • Added Risk Pricing: In the absence of PAC clauses contractors may add contingencies to cover material price risk. • Market Stability: A potential benefits of PACs is their ability to increase stability, perhaps leading to an increase in the number of bids. • Market Entry: Reduced uncertainty could increase the desirability of the market resulting in new entries to the market and limiting firms exiting. • Contact Default: In the absence of PACs, rapidly fluctuating prices may cause contractors to face large loses on a particular contract. This may lead to contractor defaults, non-performance, and exit from the market. • Increased Competition: The presence of PACs can potentially reduce risk, decrease the use of added risk pricing and increase bid competition. The consequent reductions of overall bid prices and increased numbers of bids per project can result in lower overall costs to DOTs.
IV – Phase II Issues and ProgressD. Benefits and Risks PotentialBenefits Potential Risks Administrative costs Costs of purchasing indexes Costs of setting up procedures (programming, software, etc.) Contractor PAC disbursements Political barriers Contractor resistance Inaccuracies due to indexes, usage factors, timing, etc. • Lower bid prices • Increased number of bidders • Market stability • Less firms exited market • Fewer contractor default / bid retractions • More equitable profits on each contract • Contractor PAC receipts
IV – Phase II Issues and Progress E. Guidelines • The project team has developed a series of strategies and arrayed the various information collected about each strategy in order to assess the benefits, costs, risks and institutional barriers for each strategy.
IV – Phase II Issues and ProgressE. Guidelines • Guidelines will include: • Criteria for Implementing a PAC Program: Summarizes the benefits and risks of implementing a PAC program. Alternative strategies will also be explored. • Criteria for Selecting Materials to Include in a PAC Program: Assesses the benefits and risks for each type of available material. • Criteria for Selecting the Attributes of a PAC Program: Based on the selected materials, outlines the different attributes of each material item and the recommended options for each attribute (i.e. opt-in strategies, trigger values, project selection).
V – Project Schedule • The project is currently on schedule. • Draft Final Report will be submitted in about one-month. • All work will be completed by the end of the year.
VI – Panel Input • The purpose of this task was to convey the progress and preliminary findings of the research • Please take time now to provide feedback on the progress and results. • Please feel free to email and/or call me or Dr. Lemer with any additional comments and suggestions. • Jonathan Skolnik, Vice President, Jack Faucett Associates, Inc. skolnik@jfaucett.com (301) 961-8834 • Andrew C. Lemer, Ph.D., TRB Cooperative Research Programs alemer@nas.edu (202) 334-3972
VI – Panel Input • “True scientific advancement can be achieved only through an iterative process in which improved theoretical formulation raised new empirical questions and answers to their questions, in their turn, lead to further theoretical insights” Wassily Leontief, Ph.D. Harvard Economic Research Project Nobel Prize Winner