Download
1 / 17
170 likes | 179 Views
Optimization of a Large-scale Water Quality Monitoring Network. The Kissimmee-Okeechobee-Everglades System. One of the most diverse ecosystems in the world It stretches 240 miles Integrating and managing the Everglades Construction Project

E N D
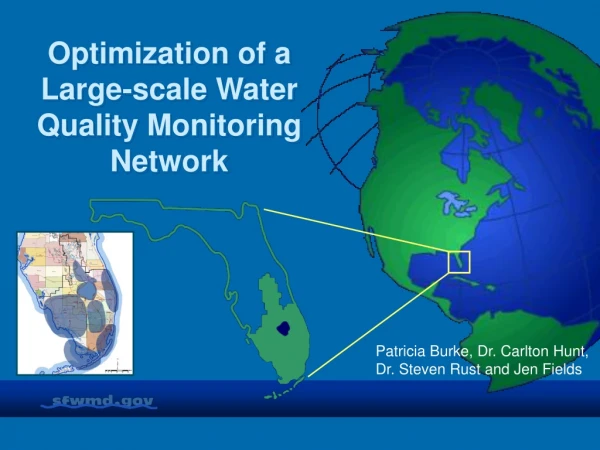
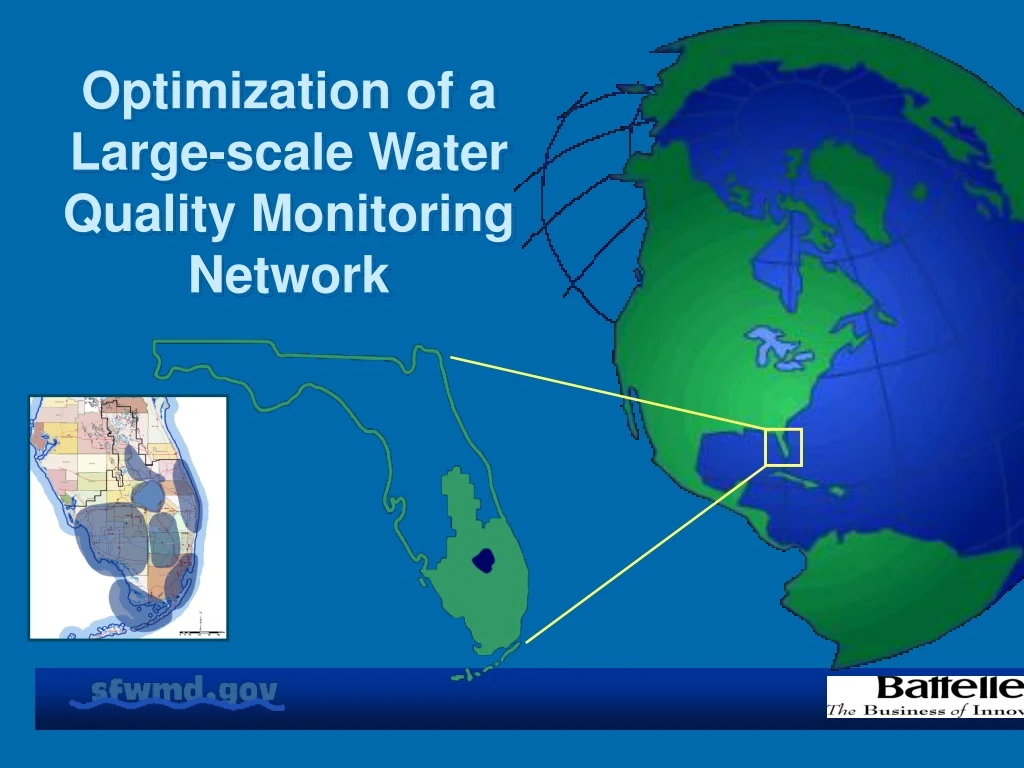
Optimization of a Large-scale Water Quality Monitoring Network
The Kissimmee-Okeechobee-Everglades System • One of the most diverse ecosystems in the world • It stretches 240 miles • Integrating and managing the Everglades Construction Project • Implementing the Comprehensive Everglades Restoration Plan
WQ Monitoring Network • Assess effects of managed actions (e.g., lake draw downs, reservoir creation, CERP) • Assess effects of upstream water bodies on downstream water bodies • TMDL and PLRG data that feed various types of modeling (development, calibration, verification) • Monitor nutrient concentrations and loadings at entry points (dairy outflows, agriculture, developments) • Monitor water quality for degradation (short- and long-term trends) • Compliance monitoring • Special studies - research - finite
Network Components • The District’s current water quality monitoring projects (or specific sites) generally fall into three of the following categories: • Type I Mandate: Work is required by state or federal statute or permit which is very specific and does not allow for much District discretion in implementation. Examples: NPDES Permit for STA-1W, Non-ECP Permit, Everglades Forever Act Permit, Operation of the C&SF System, etc. • Type II Mandate: Work is required by statute, permit, regulation or agreement and allows for some discretion. Examples: Minimum Flows and Levels, Water Supply Plans, Everglades Consolidated Report, Regulatory Programs, CERP Projects, etc. • Type III Mandate: Project is not legally mandated, but has been authorized or requested by the Governing Board, Executive Office, or another agency. This type of mandate may include ongoing research that is used to establish criteria and set parameters to obtain future funding to address relevant concerns. The District has complete discretion in implementation. Examples: SWIM Projects, most local cooperative agreements, expert assistance program, and research type monitoring that supports specific projects and District directives.
Background • Governing Board and District Management Team requested optimization of monitoring program. • Contracted with Battelle Memorial Institute in December 2004 to: • Evaluate previous optimization efforts of theregional water quality network; and • Statistically optimize the remainder of thenetwork not yet reviewed (~25%). Type II and III Levels only. • Assembled team of District lead scientists and program/project managers to oversee technical aspects of the project.
Objectives • Ensure that the District monitoring design processis scientifically defensible (right place, right time,right indicators). • Produce a comprehensive optimization plan toidentify improvements to the current monitoring design. • Identify data gaps and/or streamlining opportunities using a statistical analysis process. • Develop a blueprint for a District Monitoring Evaluation Tool that will help guide the management of current and future District monitoring efforts.
Ground Rules • Applied the U.S. Environmental Protection Agency Data Quality Objectives Process (DQO). • Utilized statistically rigorous methods to investigate temporal, spatial and parameter-driven aspects of monitoring projects. • Incorporated constraining factors in terms of logistics, QA requirements and budget considerations. • Detailed analysis of a large dataset (1.4 million records from 364 sampling locations).
Statistical Methodology • Developed Station-parameter-frequency sets associated with the project being optimized: • Specify statistical analysis procedures employed to support District use of the monitoring data, and specify the manner in which analysis results are used to make District decisions. • Identified all available reports and statistical uses of project data. • Identified use of project data in any management decisions. • Specify acceptable levels of decision error and uncertainty in statistical analysis results. Select the statistical optimization methodology to be employed and document the rationale for the selection. • Employed a 95% confidence interval • Power set at 80% for detecting annual proportion change (APC)
Statistical Methodology • Identify a critical data use – a way in which WQ monitoring data is used to answer a question or provide a baseline for answering future questions • Specify the statistical analysis procedure that will be used to answer the question or estimate baseline entities (Parametric vs. Non-parametric) • Select an optimization metric that is an indicator of how well the question can be answered or how precisely the baseline can be established based on the WQ monitoring data • Assess effects of potential changes to monitoring plans in terms of corresponding changes in the optimization metric
Optimization Metrics Metric: Standard deviation of the estimated average parameter concentration Metric: The minimum percentage exceedance that is detectable with high power Metric: Standard deviation of the estimated slope for parameter concentration vs. time Metric: Given that an event has occurred, probability that event will be detected • Use: Establish a baseline average parameter concentration • Use: Compare parameter concentration to a standard concentration • Use: Estimate the average decrease in parameter concentration over a period of time • Use: Detect the occurrence of a high parameter concentration event
Statistical Tests • Focused on key questions relating to the District water quality monitoring network: • Is the data being collected sufficient to assess the effectiveness of projects and/or practices implemented to control and improve water quality? • Spatial Optimizations: Spearman Rank Correlations • Temporal Optimizations: Monte Carlo Simulations using Seasonal Kendall Tau / Mann-Kendall trend analyses • Can the data effectively determine if sufficient progress is being made toward meeting the water quality goals and objectives of these initiatives? • Power Analysis procedures: Estimate Annual Proportion Change (APC) using two-sided t or z test • Ran models with frequency of collection > and < current
Products • Defined project objectives and goals, described all data uses, and determined the management and policy decisions the data will support. • Ensured data used for statistical analyses were appropriate, complete, and accurate. • Defined geographic domains and whether the data for individual sites or geographic regions were to be evaluated • Developed a Power Analysis Procedure For Trend Detection With Accompanying SAS Software (Dr. Steve Rust) • Addressed seasonal trends and autocorrelation to ensure statistical results are not overstating the power of the monitoring to detect trends. • Applied the power analysis to alternative monitoring designs.
Power Analysis Procedure For Trend Detection With Accompanying SAS Software Mixed model fitted to the data • Fits data to form a basis for generating simulated water quality parameter data to support a Monte Carlo based power analysis procedure • Generate multiple replicate simulated water quality time series data sets • Perform a Seasonal Kendall’s Tau trend analysis procedure for each simulated time series data set • Gives a point estimate of the slope vs. time for the log-transformed water quality parameter values • Estimate the annual proportion change (APC) in water quality parameter values that is detectable with 80% power using a simple two-sided test based on the slope estimate performed at a 5% significance level • Seasonal Kendall Tau Test for Trend
Results • Projects are not isolated • Complex array of end users • Data often feed more than one report or mission • All water quality monitoring projects had clearly defined objectives and data end users, except Project RAIN. • High temporal variability and fixed seasonal effects evident within most projects. • Substantial autocorrelation within the time series data for most parameters within a project (limits the ability to obtain truly independent samples). • Understanding seasonal water flow into and from a project’s area is a key element of optimization • Communication with stakeholders (program managers, data users, etc.) critical component to successful optimization efforts.
Recommendations • The optimization process identified several parameters (Chlorophyll b and Chlorophyll c, and carotenoids) that are not used by District investigators or others. It was recommended that these parameters not be routinely measured in the Districts projects. • Continue to pursue the elimination of Project RAIN from the network. • Need to reach consensus on acceptable level of annual percent change by parameter/project. Precision and confidence levels need to be suitable to the monitoring objective and the type of data collected. If we need to be able to detect smaller changes (i.e., 5%) then many of projects can not achieve this due to autocorrelation and variability. (Critical as we construct CERP restoration projects – adaptive assessment will be used extensively – RECOVER) • Use results of power analysis runs showing current and alternative monitoring designs to optimize projects for achievement of long term water quality goals and objectives.
Action Items • District staff to evaluate the efficacy of Battelle’s project specific optimization recommendations, and implement with stakeholder approval where appropriate. -Developed Decision Matrix: Budgetary, QA/QC, Political, Unidentified Data Needs, etc. • Develop a District-specific Monitoring Evaluation Tool to periodically evaluate current networks and to ensure future monitoring operations are efficient and cost effective. -Will utilize the Power Analysis Procedure for Trend Detection and accompanying SAS Software
WWW.SFWMD.GOV • Final Report and Power Analysis Procedure Available on Web Site • Data and Reports/Technical Publications/ERA #441