Download
1 / 12
120 likes | 346 Views
Unsupervised Learning. Find patterns in the data. Group the data into clusters. Many clustering algorithms. K means clustering EM clustering Graph-Theoretic Clustering Clustering by Graph Cuts etc. Clustering by K-means Algorithm.

E N D
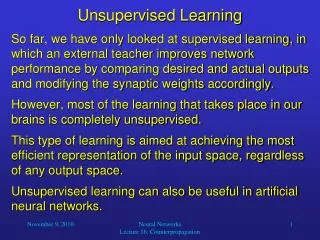
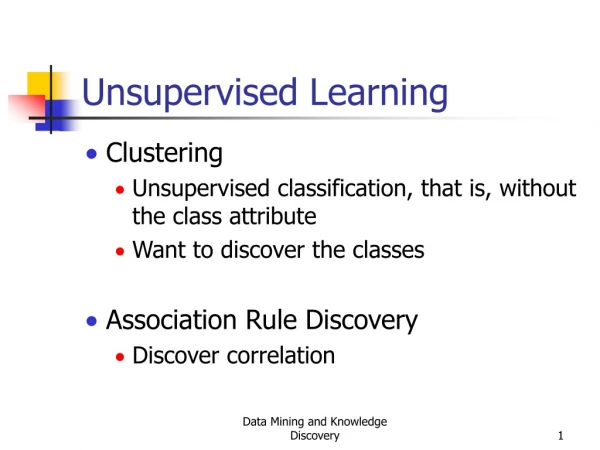
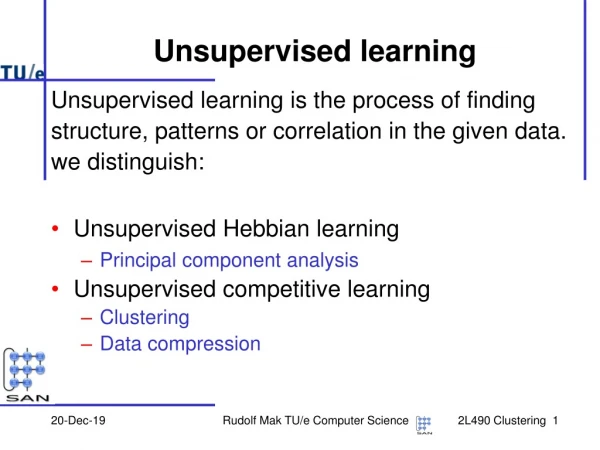
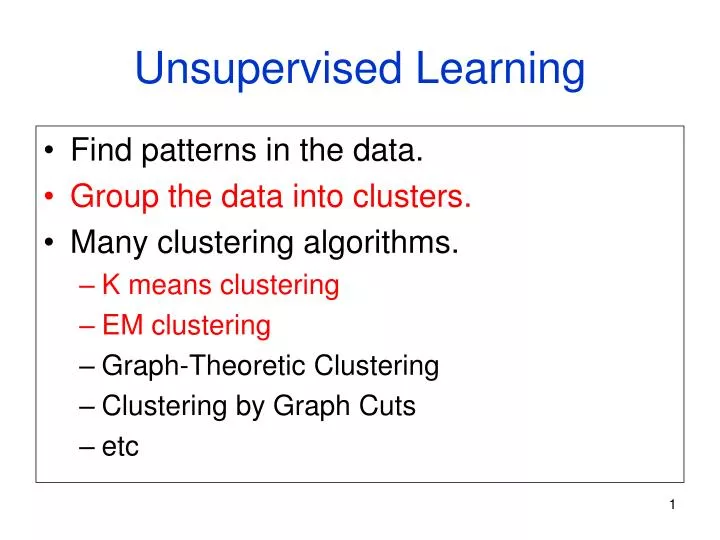
Unsupervised Learning • Find patterns in the data. • Group the data into clusters. • Many clustering algorithms. • K means clustering • EM clustering • Graph-Theoretic Clustering • Clustering by Graph Cuts • etc
Clustering by K-means Algorithm Form K-means clusters from a set of n-dimensional feature vectors 1. Set ic (iteration count) to 1 2. Choose randomly a set of K means m1(1), …, mK(1). 3. For each vector xi, compute D(xi,mk(ic)), k=1,…K and assign xi to the cluster Cj with nearest mean. 4. Increment ic by 1, update the means to get m1(ic),…,mK(ic). 5. Repeat steps 3 and 4 until Ck(ic) = Ck(ic+1) for all k.
x1={r1, g1, b1} x2={r2, g2, b2} … xi={ri, gi, bi} … K-Means Classifier(shown on RGB color data) Classification Results x1C(x1) x2C(x2) … xiC(xi) … Classifier (K-Means) Cluster Parameters m1 for C1 m2 for C2 … mk for Ck original data one RGB per pixel color clusters
K-Means Classifier (Cont.) Input (Known) Output (Unknown) x1={r1, g1, b1} x2={r2, g2, b2} … xi={ri, gi, bi} … Classification Results x1C(x1) x2C(x2) … xiC(xi) … Cluster Parameters m1 for C1 m2 for C2 … mk for Ck
For each cluster j K-Means EMThe clusters are usually Gaussian distributions. • Boot Step: • Initialize K clusters: C1, …, CK • Iteration Step: • Estimate the cluster of each datum • Re-estimate the cluster parameters (j,j) and P(Cj)for each cluster j. Expectation Maximization The resultant set of clusters is called a mixture model; if the distributions are Gaussian, it’s a Gaussian mixture.
Expectation Step Input (Known) Input (Estimation) Output x1={r1, g1, b1} x2={r2, g2, b2} … xi={ri, gi, bi} … Cluster Parameters (1,1), p(C1) for C1 (2,2), p(C2) for C2 … (k,k), p(Ck) for Ck Classification Results p(C1|x1) p(Cj|x2) … p(Cj|xi) … +
Maximization Step Input (Known) Input (Estimation) Output x1={r1, g1, b1} x2={r2, g2, b2} … xi={ri, gi, bi} … Classification Results p(C1|x1) p(Cj|x2) … p(Cj|xi) … Cluster Parameters (1,1), p(C1) for C1 (2,2), p(C2) for C2 … (k,k), p(Ck) for Ck +
EM Clustering using color and texture information at each pixel(from Blobworld)
Final Model for “trees” Initial Model for “trees” EM Final Model for “sky” Initial Model for “sky” EM for Classification of Images in Terms of their Color Regions
Sample Results cheetah
Sample Results (Cont.) grass