Download
1 / 11
110 likes | 169 Views
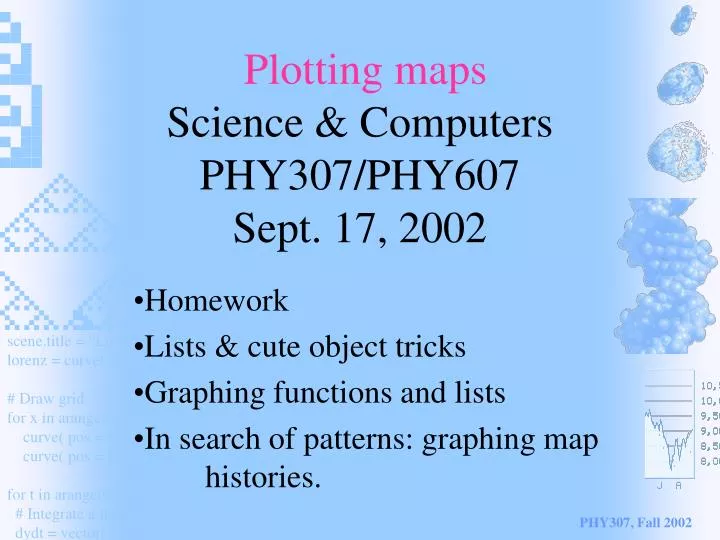
Plotting maps Science & Computers PHY307/PHY607 Sept. 17, 2002. Homework Lists & cute object tricks Graphing functions and lists In search of patterns: graphing map histories. Homework. See notes online about logistic map and color. Sample program will also posted.

E N D
Plotting mapsScience & ComputersPHY307/PHY607Sept. 17, 2002 Homework Lists & cute object tricks Graphing functions and lists In search of patterns: graphing map histories. PHY307, Fall 2002
Homework • See notes online about logistic map and color. Sample program will also posted. • Quartic map should be similar to the logistic map qualitatively, but differs in quantitative detail. PHY307, Fall 2002
Lists • Lists can be of numbers, box’s, other lists: • [1,2,3,4] • [boxa, boxb] • [[1,2,3],[4,5,2]] • Lists can be made using, for example, range() • listA = range(0,100,5) PHY307, Fall 2002
Lists • Lists can be appended to: listA = [1,2,5] listA.append(6) print listA PHY307, Fall 2002
Lists • Another example: listA = [] # empty list listA.append(box(x=0)) listA.append(box(x=2)) while 1: # loop forever rate(20) for abox in listA: # for each box abox.y = abox.y + 0.01 # move up PHY307, Fall 2002
What does this do? from visual import * scene.autoscale = 0 objlist = [] for j in range(30): objlist.append(ring(x=j-15)) while 1: rate(20) for r in objlist: r.rotate(angle=0.01,axis=(0,1,0)) PHY307, Fall 2002
Graphing • Lists of data can be plotted in VPython • Need extra statement: from visual.graph import * • This gives ability to do 2D plots. PHY307, Fall 2002
integers are not real • Try out print 2/3 print 2./3. • If not careful, and divide an integer by an integer, can run into trouble. So: • Use ‘.’ with abandon, e.g., a = a + 2.0 • Use arange instead of range PHY307, Fall 2002
For example from visual.graph import * data = [] for x in arange(0, 2, 0.01): data.append((x, x*x)) curveA = gcurve(pos=data, color=color.red) PHY307, Fall 2002
Plotting one point at a time: from visual.graph import * curveA = gdots() for x in range(0, 200): rate(6) curveA.plot(pos=(x,sin(x/10.))) PHY307, Fall 2002
Plotting map histories: from visual.graph import * curveA = gdots() y = 0.5 for t in range(0, 40): rate(3) y = y * 0.95 curveA.plot(pos=(t,y)) PHY307, Fall 2002