Download
1 / 21
210 likes | 415 Views
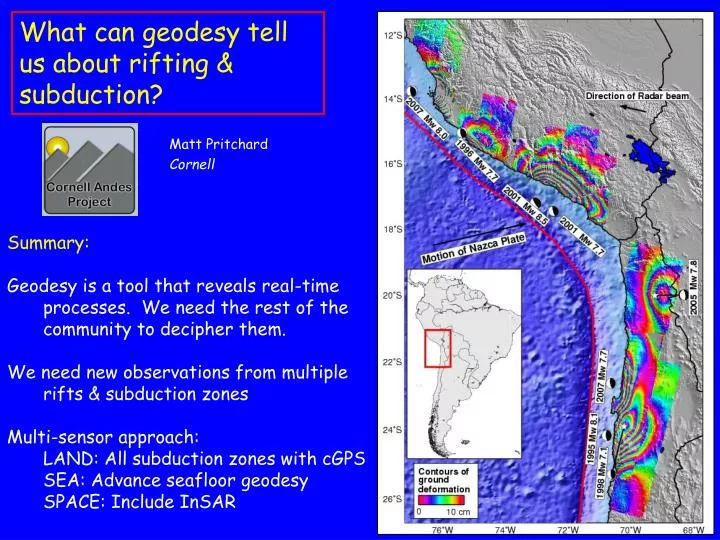
What can geodesy tell us about rifting & subduction?. Matt Pritchard Cornell. Summary: Geodesy is a tool that reveals real-time processes. We need the rest of the community to decipher them. We need new observations from multiple rifts & subduction zones Multi-sensor approach:

E N D
What can geodesy tell us about rifting & subduction? Matt Pritchard Cornell Summary: Geodesy is a tool that reveals real-time processes. We need the rest of the community to decipher them. We need new observations from multiple rifts & subduction zones Multi-sensor approach: LAND: All subduction zones with cGPS SEA: Advance seafloor geodesy SPACE: Include InSAR
What can InSAR tell us about rifting & subduction? Matt Pritchard Cornell Rifting: Comparison of 3 rifting events indicates varying importance of magma & earthquakes Subduction zones: 1) More detailed earthquake slip maps 2) Overlapping slow & fast slip 2) Can we predict locations of large earthquakes? 3) Role of upper-plate faulting?
Recent rifting events 2009 Harrat Lunayyir Saudi Arabia Geodetic 2005-2009 Dabbahu, Afar 2007 Gelai, Tanzania Map from Juliet Biggs
July 17th July 21st July 23rd Time Temporal evolution of Tanzania event Rifting Event Biggs et al, GJI, 2009
Modeling: Dyke + fault + Magma chamber Model Data Biggs et al, GJI, 2009
Summary of 3 recent rifting events studied with seismology & geodesy From: Baer & Hamiel, 2009
Central Andes earthquakes1992-2007 4 earthquakes > Mw 8.0 (3 shallow, 1 event > 600 km deep) 1995 Mw 8.1 Antofagasta, Chile 2001 Mw 8.5 Arequipa, Peru 2007 Mw 8.1 Pisco, Peru 8 additional earthquakes > Mw 7.0 (5 shallow, 3 events > 200 km deep) 1996 Mw 7.7 Nazca, Peru 1998 Mw 7.1 Antofagasta, Chile 2001 Mw 7.6 Arequipa, Peru 2005 Mw 7.8 Tarapaca, Chile (110 km deep!) 2007 Mw 7.7 Tocopilla, Chile (Pritchard et al., 2002; Salichon et al., 2003; Pritchard et al., 2006; Peyrat et al., 2006; Delouis & Legrand, 2007; Pritchard et al., 2007; Pritchard & Fielding, 2008; Loveless et al., 2010)
Example: 1998 Mw 7.1 earthquake Cross-section Map view
Map fault slip before, during, & after earthquakes Joint seismic & geodetic estimates of earthquake and after-slip 1995-2007 in northern Chile Loveless & Pritchard, 2010
Role of along-strike variabilityConflicting(?) SEIZE summary slides Evidence for after-slip within the “normal” earthquake zone 2003 Tokachi-Oki (below) 1995 Chile (Pritchard & Simons, 2006), etc. This profile reveals new features recently discovered phenomena 2D profiles are not universal!
Compare actual & predicted interferograms from different slip models Slip models from seismic and sparse geodetic data do not match InSAR
Why slip distributions matter Coulomb stress change on upper plate faults from 1995 Mw 8.1 earthquake 7 co-seismic slip models predict different direction of slip: Normal fault motion encouraged by some models Reverse motion discouraged or neutral in our joint model From Loveless & Pritchard (2008) Model 1: Delouis et al., 1997; Model 2: Klotz et al., 1999; Model 3: Xia et al., 2003; Model 4: Pritchard et al., 2002; Model 5: Ihmle and Ruegg, 1997; Model 6: Pritchard et al., 2006; Model 7: Pritchard et al., 2006
Splay fault motion during 1964 Alaska earthquake Profile in next slide
Patton Bay and Hanning Bay faults moved up to 8 m From: Plafker, 1972 •Co-seismic splay fault motion(?) during 1946 Nankaido, Japan earthquake (Kato, 1983) •No evidence for upper-plate motion in northern Chile (Loveless & Pritchard, 2008) or Cascadia (Finnegan et al., 2008)
2007 Sumatra earthquake sequence Interferograms from ALOS satellite Images from: Geological Survey Institute, Japan Mw 8.4 Sept. 12, 2007 12 hours later Mw. 7.9 Konca et al., 2008
Conclusions Some lessons learned Different amounts of aseismic deformation during rifting events Along-strike variations in subduction zones can be as important as down-dip changes No single parameter seems to control location of “asperities” Geodesy addresses many questions: Spatial & temporal distribution of fault slip (including updip limit) Post-seismic deformation & rheology of fault/rift zones Detailed picture of seismogenesis Role of magma & other fluids The way forward: Sea (Seafloor Geodesy & OBS): Focused sites Options for vertical & horizontal continuous or campaign measurements See Chadwell SEIZE talk Land (GPS & seismology): All subduction zones(?) for real-time tsunami warning MARGINS could lead international effort Why MARGINS? Addresses scientific & societal objectives Space (InSAR): Everywhere subaerial Free data available in the future (MARGINS should support this) Purchase archived data over all MARGINS Why MARGINS? Global scale beyond capability of individual PI
Gravity anomalies & slip in southern Peru From: Loveless et al., 2010 Nazca Ridge Fracture Zone
Could we have large areas of slip (asperities) in South American earthquakes? 1) Lower plate structure • Temperature (irrespective of age, Newman et al., 2002) • Seamounts (e.g., Small & Scholz, 1997; Bilek et al., 2003) • Fracture zones (e.g., Robinson et al., 2006) • Plate dip (Mitsui & Hirahara, 2006) 2) Upper plate structure • Isostatic anomaly proxy for lithologic changes (Sobiesak, 2004) • Upper crustal faults oblique to coastline (e.g., Collot et al., 2004) 3) Empirical features (origin unknown) • Shape of the coastline • Existence of peninsulas • Gravity lows associated with large earthquakes -- proxy for lower & upper plate structure (Song & Simons, 2003; Wells et al., 2003) 4) Interface properties: • Sediment: Composition, amount or thickness (e.g., Ruff, 1989) • Magnitude or importance of subduction erosion • Normal stresses on plate interface (e.g., Scholz & Campos, 1995)
No: No single property can explain co-seismic “asperities” for all earthquakes Comparing various physical properties of subduction zones with co-seismic slip location Gradients in the gravity field (Llenos & McGuire, 2007) are perhaps useful From: Loveless et al., 2010
Some ideas for MARGINS successor program Incorporate InSAR into MARGINS to achieve SEIZE & RCL goals Achieves SEIZE goal of comparing different subduction zones Purchase archived data complementary to existing available datasets Support future acuisitions via Sentinel & DESDynI Assess along-strike variations by deploying geodetic arrays in all subduction zones Understand the factors that control slow slip Added benefit for real-time tsunami warning Would also achieve Wang’s goal of measuring different stages of the seismic cycle via observations in different subduction zones Can off-shore observations give us predictive capability for megathrust slip properties? Detailed study of off-shore faults & topography, seismicity, tomography, etc. is useful for comparing with fault slip on the megathrust Monitor strain, pore-pressure, tremor & seismic activity in the submarine wedge (SEIZE summary) Seafloor geodesy: (From SEIZE summary & Chadwell talk) What types (vertical pressure gauges; horizontal acoustic, etc.?)? Where to deploy? (up-dip limit; densifying in seismic gaps; post-seismic, etc.?) How many instruments could we afford, given other objectives?