Download
1 / 21
210 likes | 561 Views
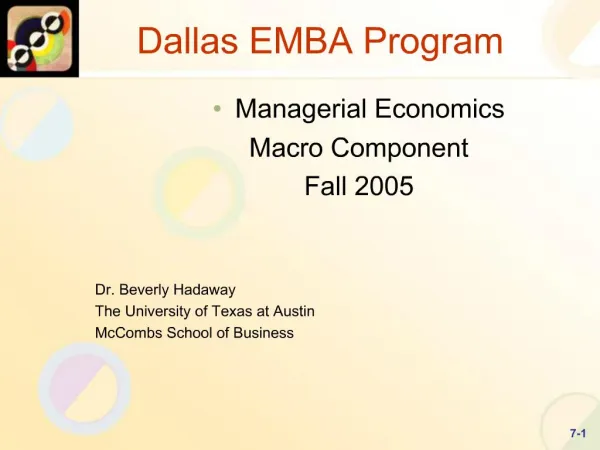
University of Washington EMBA Program Regional 20. “Quantitative Analysis for Marketing” T.A.: Rory McLeod . Basic Quantitative Analysis for Marketing. Fixed, Variable, and Total Cost. Total Cost. Cost. k = variable cost per unit. Fixed Cost. Volume (Quantity). V.

E N D
University of Washington EMBA ProgramRegional 20 “Quantitative Analysis for Marketing” T.A.: Rory McLeod
Fixed, Variable, and Total Cost Total Cost Cost k = variable cost per unit Fixed Cost Volume (Quantity) V Total Cost for output level V units = fixed cost + k*V As you produce more units, the average cost per unit goes down (fixed costs are spread out over more units).
Example: Safeco Field Tickets Fixed cost = $40,000,000 (player/manager/staff salaries, overhead, etc.) Variable cost per seat sold (k) = 400 (shipping of tickets, custodial staff, maintenance, etc.) Total # of seats = 46,000 If all seats are sold, variable costs are $18,400,000. Total cost 58,400,000. Total cost per seat if all seats are sold 1,270 If only half of the seats are sold, the total cost per unit is ___, because the fixed costs of $40,000,000 are only covered by sale of 23,000 seats. (These are made up figures!)
Unit Contribution and Total Contribution Unit Contribution = P – k (P = price charged) Total Contribution = (P – k) * V = PV– kV = Price charged minus variable costs. This is what you have left over to cover your fixed costs and profit.
Safeco Field Ticket Contribution at $2500 Price Assume season tickets are sold for $2500 on average. Unit contribution = $2500 - $400 = $2,100 Total contribution, assuming all 46,000 seats are sold = $2100 * 46,000 = $96,600,000 This tells us that after fixed costs of $40,000,000, we will have a profit of $56,600,000. If only half of the seats are sold, our total contribution = $2100*23,000 = $48,300,000, leaving us with a profit of $8,300,000
Safeco Field Ticket Contribution at $2000 price Assume season tickets are sold for $2000 on average. Unit contribution = $2000 - $400 = $1600 Total contribution, assuming all 46,000 seats are sold = $1600 * 46,000 = $73,600,000 This tells us that after fixed costs of $40,000,000, we will have a profit of $33,600,000. If only half of the seats are sold, our total contribution = _________________ leaving us with a ______________.
Think of the impact of a winning season on your ability to price!
Margin(Financial people like to confuse you!) $ Margin = Selling price – variable cost (In this case, Margin is the same as unit contribution) Beware, margin can often mean different things. Make sure you have clarification of the specific elements included. % Margin = (Selling price – variable cost) / Selling price * 100% (this shows the % as a whole number instead of a decimal)
$ Volume (Units) Break – Even Volume (BEV) Total Revenue (Price * V) Total Cost (Fixed Cost + k*V) BEV
Break – Even Volume (BEV) • BEV is the point at which • Total Revenue = Total Cost • Or said differently, you are at break even • when Price * V = Fixed cost + (k*V) • BEV = Fixed cost / (Price – k) • Or more simply • BEV = Fixed cost / Unit contribution
Application of Break Even Analysis to Advertising Expenditure Example. An advertising campaign costing $500,000 has been proposed for Safeco tickets with a unit contribution of $1,600. How many additional seats will need to be sold as a result of the campaign in order to justify its costs?? How many at $2,100? $500,000 / $1600 per seat = 313 seats $500,000 / $2100 per seat = 238 seats What if the proposed campaign cost $2,000,000? How many seats would we have to sell to break even at $1,600/seat and $2,100/seat?
It is important to remember… • Numbers have more meaning when there is a benchmark against which to compare them. • Market size • Growth rate • Competitive activity • For example, if we determine that we need to sell 78,125 units of a product to break even… • What does this mean for a product that is part of a • highly competitive, stable market with 150,000 units sold annually • vs. • an emerging, fast-growing market with 1,000,000 units sold annually.
Market Potential • Market potential (Demand) = potential # of buyers * average quantity purchased by a buyer * price Potential buyers are the people for whom your product is a solution to their need. It is not a function of your manufacturing capacity.
Company Demand Forecast • Company Demand Forecast (Potential): the amount of sales of the market potential you believe you can capture, relative to that of competitors. • E.g. if you have a superior product, you will have a higher demand forecast than if your competitors’ products were superior. • Company Sales Forecast: expected level of company sales based on a chosen marketing plan– this reflects your efforts to take advantage of the company demand forecast.
Forecasting Methods • 3-stage procedure: prepare a macroeconomic forecast (based on expected inflation, unemployment, interest rates, consumer spending, etc.), followed by an industry forecast, followed by a company sales forecast • Based on what people say: • Survey of buyers’ intentions/needs • Composite of sales force opinions • Expert opinion • Put the product into a test market and measure buyer response • Analyze records of past buying behavior and use a statistical method of projecting this behavior into the future
Business Objectives • Profit (Revenue – Total Cost) • Market Share • Specify share of what market (global, national, regional, etc.) • Dollars vs. % • Revenues • Growth • Return on Investment (ROI) = net income / total investment * 100% • Return on Equity (ROE) = net income / owners’ equity * 100% • Return on Assets (ROA) = net income / total assets * 100%