Download
1 / 27
270 likes | 278 Views
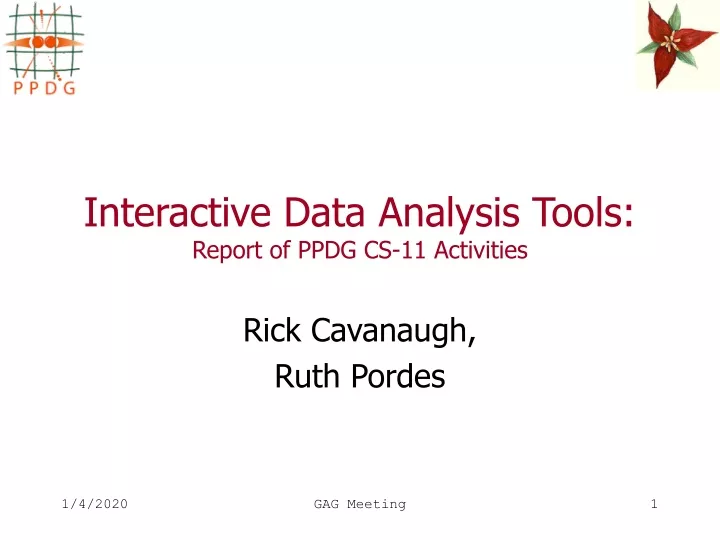
Interactive Data Analysis Tools: Report of PPDG CS-11 Activities. Rick Cavanaugh, Ruth Pordes. CS-11 Goals, Scope. Interface and Integrate Interactive Data Analysis Tools with the Grid Identify Common Components and Services Task oriented approach

E N D
Interactive Data Analysis Tools:Report of PPDG CS-11 Activities Rick Cavanaugh, Ruth Pordes GAG Meeting
CS-11 Goals, Scope • Interface and Integrate Interactive Data Analysis Tools with the Grid • Identify Common Components and Services • Task oriented approach • Identify concrete tasks which can be accomplished in relatively short order (within months) • Involves a broader HEP community than the LHC • ATLAS, BaBar, CMS, D0, etc • Led by Doug Olson (LBL) and Joe Perl (SLAC) GAG Meeting
Four Models Considered for Interactive Analysis on the Grid • Grid as a Black Box • Real-time Batch • Interactive Batch • Pre-started Analysis Services GAG Meeting
GRID as black box Select and extract data from grid, Analyze using local resourceswithout Further interaction with grid Grid as a Black-Box • User performs queries for data from the grid • Data is extracted and stored on local, non-grid resources • Analysis performed without using the grid GAG Meeting
Grid controller Compute nodes Local resources Real-time Batch • Work is submitted to a grid scheduler which distributes it across grid nodes • Intermediate results from the individual batch jobs are returned to the user • No interaction with individual batch jobs GAG Meeting
Interactive Batch • Similar to real-time batch model with the addition of control channels between user and analysis jobs • User can modify analysis jobs as they run • User may have a rich desktop environment providing fine grained control and feedback GAG Meeting
MetadataCatalog Service ReplicaCatalog Service Desktops Portals Match-makingService InformationService AnalysisServers Pre-started Analysis Services • Persistent analysis services run on pre-determined servers • Capable of discovering grid resources and executing analysis tasks for users • Early examples of such analysis services include • PROOF • Distributed JAS • Does not necessarily have the view of a batch model GAG Meeting
Interactive Data Analysis Use-cases and Requirements • 23 (so far) identified use-cases for Grid Services • Detailed in a PPDG CS-11 document GAG Meeting
Select data Select subset of data Inspect data Move data Choose version of code Run mini-analysis Retrieve results Estimate resources Negotiate availability Run full-analysis Check status View results Suspend/resume analysis Abort analysis View results Display events Add refined data Share refined data Add tag data Compare results Calculate cross sections Maintain audit trail Security and access control Current List of Requirements for Grid Services GAG Meeting
Definition of Interactive Data Analysis APIs • 18 (so far) APIs identified • Abstract Job submission • Concrete Job Interaction, Control, Status, Capabilities • Data Mover • Etc. GAG Meeting
APIs for Interactive Data Analysis using the GRID Abstract Job Submission API Purpose of this diagram is not to show exact architecture (there is no one architecture that represents all possible systems for interactive analysis on the grid) but to find a more or less complete list of what grid APIs/services are needed by such interactive analysis. A later step is then to take these APIs one at a time to search for an existing API/ extend an API or create a new API to meet these needs. Concrete Job Submission API MatchmakerAPI Grid Node Concrete Job Control API Resource Discovery API Grid Node Concrete Job Status API Grid Node Resource Reservation API (may or may not be supported) Concrete Job Capabilities API Grid Node Grid Node Subjob Management API Analysis Tool(SuperPAW) GRID Storage API Grid Node EstimatorAPI Grid Node Data MoverAPI Grid Node Grid Node Other AnalysisTool Maybe a Portal Design Dataset Catalog Service Query API Grid Node Grid Node Dataset Catalog Service Management API Sign OnAPI Grid Node Replica LocationAPI Grid Node Software Installer API http://www.ppdg.net/mtgs/20mar03-cs11/APIsBriefDefs.doc Metadata Catalog API Grid Node GAG Meeting Joseph Perl and 20-21 March 2003 CS11 Workshop Participants
A I D A User code (e.g. GEANT4) AIDA Analysis tool 1 Analysis tool 2 Analysis tool 3 Language 1 Language 2 AIDA End User ViewAbstract Interfaces for Data Analysis • Use same code with any AIDA-compliant analysis tool. • User only has to learn one set of terminology • Can use best tool for the job • Can migrate to new tools as they become available • Can interchange data between tools GAG Meeting
AIDA Developer ViewAbstract Interfaces for Data Analysis • Started with 3 separate teams with different goals, constraints and terminology • By collaborating on interfaces the AIDA group were able to • Separate design of user-interface from implementation • Harness combined experience of many people, while leaving individual teams to produce implementations that target their own needs • Generate tools that are better than any one team would have produced alone • Share IO formats, test suites, utilities, and ultimately components GAG Meeting
Possible interfaces forGrid Data Analysis GAG Meeting
Examples of Participants in CS-11 • Package/Team • ROOT and PROOF • JAS and JAS w/ COG • Clarens and CMS Grid Enabled Analysis • Chimera • Grappa and Ganga • Dial • SAM • several others… • Represents a diverse set of ideas and implementations GAG Meeting
stdout/obj ana.C proof proof proof proof = slave server PROOF (CERN & MIT) Local PC Remote PROOF Cluster root proof *.root TFile node1 ana.C *.root TNetFile $ root $ root root [0] .x ana.C $ root root [0] .x ana.C root [1] gROOT->Proof(“remote”) $ root root [0] tree.Process(“ana.C”) root [1] gROOT->Proof(“remote”) root [2] chain.Process(“ana.C”) node2 TFile *.root node3 proof proof = master server TFile *.root GAG Meeting node4 This slide and next: Maarten Ballintijn and Fons Rademakers. Collaboration between ROOT and the MIT Heavy Ion Group
Distributed Java Analysis Studio (JAS) Goal: clustered deployment, launch, & federation Minimal prerequisites: Bare grid: Globus, Java, nothing else Heterogeneous cluster Off-grid (or not) client, data, codebase Clients don’t need to be superusers Optional background deployment Single sign on GAG Meeting
Clarens RPC SERVICE Client WEB CLARENS HTTP/SOAP/RPC Server • The Clarens Remote Dataserver: a WAN system for remote analysis of data • Clarens servers are deployed at Caltech, Florida, UCLA, UCSD, FNAL • SRB now installed as Clarens service on Caltech Tier2 (Oracle backend) GAG Meeting
The Chimera Virtual Data System VDL XML VDC XML Abs. Plan Logical • Abstract data/workflows (Virtual Data DAG) • Resource locations unspecified • File names are logical • Data destinations unspecified • Concrete data/workflows (DAGs for DAGMan) • Resource locations determined • Physical file names specified • Data delivered to and returned from physical locations DAX RLS C. Plan. DAG Physical DAGMan Plots, Tables, Fits AOD Raw ESD TAG Real Data Comparisons Plots, Tables, Fits • History of a Data Analysis (like CVS) • "Check-point" a Data Analysis • Analysis Development Environment • Audit a Data Analysis Simulated Data GAG Meeting
Grappa: A Web Portal Browser Command line • User Xbook (notebook scripts) • scripts customized for the user (as simple or complex as desired) • Athena xbook customized for ATLAS job submission • Many scripting languages supported (Jython, Python, Perl…) • Xbooks server • A Jetspeed portlet • manages requests from user xbook • Jetspeed: Apache-Jakarta web portlet framework • Tomcat server: provides the web server Grappa Portal The “Grid” GRAM Services -compute sites Web Services -Magda Catalogue -Ganglia Monitor -ATLAS web services GridFTP Services -Athena Libraries -packaged physics apps -data storage Replica Locator Service GAG Meeting
GUI PYTHON SW BUS GaudiPython PythonROOT LRMS Athena\GAUDI XML RPCserver PYTHON SW BUS LAN/WAN GRID Server Production DB Bookkeeping DB Local Job DB EDG UI OS Module XML RPC module GANGA Core Module Remote user (client) Job Configuration DB Ganga: Python Bus Design GAG Meeting
DIAL:Distributed Interactive Analysis of Large datasets • DIAL provides a connection between • Interactive analysis framework • Fitting, presentation graphics, … • E.g. ROOT • and Data processing application • E.g. athena for ATLAS • Natural for the data of interest • DIAL distributes processing • Among sites, farms, nodes • To provide user with desired response time GAG Meeting
SAM Simplified Database Schema(quite complicated in reality) MC Process & Decay Data Tier Run Run Conditions Luminosity Calibration Trigger DB Alignment Physical Data Stream Events ID Event Number Trigger L1 Trigger L2 Trigger L3 Off-line Filter Thumbnail Files ID Name Format Size # Events Trigger Configuration Event-File Catalog Project File Storage Locations • SAM schema has over 100 tables • There are several other related tablespaces also available Creation & Processing Info Station Config. & Cache info Group and User information Volume GAG Meeting
Technologies being studiedby CS-11 • Portals, Portlets • XCAT, Jetspeed, etc • Web Services • SOAP, WSDL, UDDI, etc • Grid Services • Resource Broker, RLS, Virtual Data System, etc • OGSA/I GAG Meeting
Conclusion:Interactive Data Analysis Tools • CS-11 is making good progress in defining • Use-cases and requirements (middle stages) • APIs for different Grid/Web Services (early stages) • Several participating groups in CS-11 are also developing prototypes/tools • PROOF, JAS w/ CoG, Clarens, Grappa/GANGA, etc • Represents a good sampling of different ideas • Work is underway to understand better what OGSA/I brings to the picture GAG Meeting