Download
1 / 35
390 likes | 821 Views
PROBABILITY CONCEPTS. Key concepts are described Probability rules are introduced Expected values, standard deviation, covariance and correlation for individual portfolio returns are explained. Probability Terminology. Random variable : uncertain number

E N D
PROBABILITY CONCEPTS • Key concepts are described • Probability rules are introduced • Expected values, standard deviation, covariance and correlation for individual portfolio returns are explained
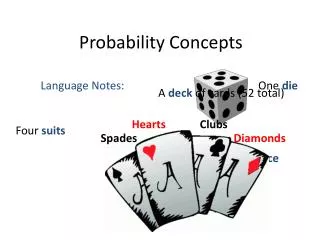
Probability Terminology Random variable: uncertain number Outcome: realization of random variable Event: set of one or more outcomes Mutually exclusive: cannot both happen Exhaustive: set of events includes all possible outcomes
Two Properties of Probability Probability of an event, P(Ei), is between 0 and 1 0 ≤ P(Ei) ≤ 1 For a set of events that are mutually exclusive and exhaustive, the sum of probabilities is 1 ΣP(Ei) = 1
Types of Probability • Empirical: based on analysis of data • Subjective: based on personal perception • A priori: based on reasoning, not experience
Odds For or Against Probability that a horse will win a race = 20% Odds for: 0.20 / (1 – 0.20) = 1/4 = one-to-four Odds against: (1 – 0.20) / 0.20 = 4/1 = four-to-one
Conditional vs. Unconditional Two types of probability: Unconditional: P(A), the probability of an event regardless of the outcomes of other events, e.g., probability market will be up for the day Conditional: P(A|B), the probability of A given that B has occurred, e.g., probability that the market will be up for the day, given that the Fed raises interest rates
Joint Probability The probability that both of two events will occur is their joint probability Example using conditional probability: P (interest rates will increase) = P(I) = 40% P (recession given a rate increase) = P(R|I) = 70% Probability of a recession and an increase in rates, P(RI) = P(R|I) × P(I) = 0.7 × 0.4 = 28%
Probability that at Least One of Two Events Will Occur P(A or B) = P(A) + P(B) – P(AB) We must subtract the joint probability P(AB) Don’t double count P(AB)
Addition Rule Example P(I) = prob. of rising interest rates is 40% P(R) = prob. of recession is 34% Joint probability P(RI) = 0.28 (calculated earlier) Probability of either rising interest rates or recession = P(R or I) = P(R) + P(I) – P(RI) = 0.34 + 0.40 – 0.28 = 0.46 For mutually exclusive events the joint probability P(AB) = 0 so: P(A or B) = P(A) + P(B)
Joint Probability of any Number of Independent Events Dependent events: knowing the outcome of one tells you something about the probability of the other Independent events: occurrence of one event does not influence the occurrence of the other. For the joint probability of independent events, just multiply Example: Flipping a fair coin, P (heads) = 50% The probability of 3 heads in succession is: 0.5 × 0.5 × 0.5 =0.53 = 0.125 or 12.5%
Calculating Unconditional Probability Given: P (interest rate increase) = P(I) = 0.4 P (no interest rate increase) = P(IC) = 1 – 0.4 = 0.6 P (Recession | Increase) = P(R|I) = 0.70 P (Recession | No Increase) = P(R|IC) = 0.10 What is the (unconditional) probability of recession? P(R) = P(R|I) × P(I) + P(R|IC) × P(IC) = 0.70 × 0.40 + 0.10 × 0.60 = 0.34
An Investment Tree EPS = $1.80 Prob = 18% Prob of good stock performance 30% EPS = $1.70 Prob = 42% Prob of good economy 70% 60% Expected EPS = $1.51 40% 60% EPS = $1.30 Prob = 24% Prob of poor economy EPS = $1.00 Prob = 16% Prob of poor stock performance 40%
Expected Value using Total Probability Using the probabilities from the Tree: Expected(EPS) = $1.51 = .18(1.80) + .42(1.70) + .24(1.30) + .16(1.00) Conditional Expectations of EPS: E(EPS)|good economy = .30(1.80) + .70(1.70) = $1.73 E(EPS)|poor economy = .60(1.30) + .40(1.00) = $1.18
Covariance Covariance: A measure of how two variables move together • Values range from minus infinity to positive infinity • Units of covariance difficult to interpret • Covariance positive when the two variables tend to be above (below) their expected values at the same time For each observation, multiply each probability times the product of the two random variables’ deviations from their means and sum them
Correlation • Correlation: A standardized measure of the linear relationship between two variables • Values range from +1, perfect positive correlation to –1, perfect negative correlation • r is sample correlation coefficient • ρ is population correlation coefficient
Correlation Example: The covariance between two assets is 0.0046, σA = 0.0623 and σB = 0.0991. What is the correlation between the two assets (ρA,B)?
Expected Value, Variance, and Standard Deviation (probability model) Expected Value: E(X) = ΣP(xi)xi
Expected Value, Variance, and Standard Deviation (probability model) • Variance:σ2(X) = ΣP(xi)[xi – E(X)]2 • Standard deviation:square root of σ2 = 0.1136
Portfolio Expected Return • Expected return on a portfolio is a weighted average of the expected returns on the assets in the portfolio
Portfolio Variance and Standard Deviation • Portfolio variance also uses the weight of the assets in the portfolio • Portfolio standard deviation is the square root of the variance
Joint Probability Function Probabilities CovAB= 0.15 (.20- .13) (.40- .18) + 0.6 (.15- .13) (.20- .18)+ 0.25 (.04- .13) (0- .18) = 0.0066
Bayes’ Formula Prob. of interest rate cut (C) 42% Good earnings (G) 70% 60% 18% Poor earnings (P) 30% 20% 8% 40% Good earnings (G) Prob. of no interest rate cut 32% 80% Poor earnings (P) Prob (C|G) = 42/(42 + 8) = 84% Prob (C|G) = [Prob(G|C) × Prob(C)]/Prob(G) Prob (C/G) = (70% * 60% )/ (42% +8%)
Factorial for Labeling Out of 10 stocks, 5 will be rated buy, 3 will be rated hold, and 2 will be rated sell. How many ways are there to do this?
Choosing r Objects from n Objects • When order does not matter and with just 2 possible labels, we can use the combination formula (binomial formula) Example: You have 5 stocks and want to place orders to sell 3 of them. How many different combinations of 3 stocks are there?
Choosing r Objects from n Objects • When order does matter, we use the permutation formula: • You have 5 stocks and want to sell 3, one at a time. The order of the stock sales matters. How many ways are there to choose the 3 stocks to sell in order?
Calculator Solutions: nCr and nPr • How many ways to choose 3 from 5, order doesn’t matter? 5 → 2nd → nCr → 3 → = 10 • How many ways to choose 3 from 5, order does matter? 5 → 2nd → nPr → 3 → = 60 • Functions only on BAII Plus (and Professional)
Probability Functions • A probability function, p(x), gives the probability that a discrete random variable will take on the value x e.g. p(x) = x/15 for X = {1,2,3,4,5}→ p(3) = 20% • A probability density function(pdf), f(x) can be used to evaluate the probability that a continuous random variable with take on a value within a range • A cumulative distribution function (cdf), F(x), gives the probability that a random variable will be less than or equal to a given value
Properties of Normal Distribution • Completely described by mean and variance • Symmetric about the mean (skewness = 0) • Kurtosis (a measure of peakedness) = 3 • Linear combination of normally distributed random variables is also normally distributed • Probabilities decrease further from the mean, but the tails go on forever Multivariate normal: more than one r.v., correlation between their outcomes
Confidence Interval: Normal Distribution Confidence interval: a range of values around an expected outcome within which we expect the actual outcome to occur some specified percent of the time.
Confidence Interval: Normal Distribution • Example: The mean annual return (normally distributed) on a portfolio over many years is 11%, and the standard deviation of returns is 8%. A 95% confidence interval on next year’s return is 11% + (1.96)(8%) = –4.7% to 26.7%
Standard Normal Distribution • A normal distribution that has been standardized so that mean = 0 and standard deviation = 1 • To standardize a random variable, calculate the z-value • Subtract the mean (so mean = 0) and divide by standard deviation (so σ = 1)
Calculating Probabilities Using the Standard Normal Distribution Example 1: The EPS for a large sample of firms is normally distributed and has µ = $4.00 and σ = $1.50. Find the probability of a value being lower than $3.70. 3.70 is 0.20 standard deviations below the mean of 4.00.
Calculating Probabilities Using the Standard Normal Distribution Example 1 cont.: Here we need to find the area under the curve to the left of the z-value of –0.20.
Calculating Probabilities Using the Standard Normal Distribution For negative z-value calculate 1 – table value Excerpt from a Table of Cumulative Probabilities for a Standard Normal Distribution
Calculating Probabilities Using the Standard Normal Distribution • Find the area to the left of z-value + 0.20: From the table this is 0.5793 • Since the distribution is symmetric, for negative values we take 1 minus the table value • Probability of values less than $3.70 is 1 – 0.5793 = 42.07% • With a z-table for negatives, F(-0.20) = 0.4207