Download
1 / 23
230 likes | 369 Views
Statistics New Zealand and XBRL. Presentation Outline. Overview of Statistics New Zealand and the existing financial data collection framework Who is Statistics NZ What are our financial data collections Compliance costs Trying to be flexible in our data collection strategies

E N D
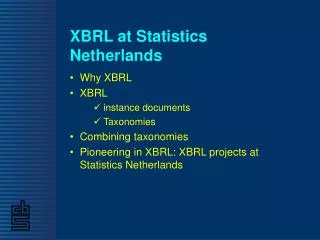
Presentation Outline • Overview of Statistics New Zealand and the existing financial data collection framework • Who is Statistics NZ • What are our financial data collections • Compliance costs • Trying to be flexible in our data collection strategies • How XBRL will fit into or even change this framework • External drivers for XBRL uptake • Benefits of XBRL in a data collection context • Taxonomies • An example of XBRL being used to meet survey requirements • Looking forward
Overview of Statistics New Zealand • Statistics New Zealand (Te Tari Tatau) is a government department and New Zealand's national statistical office • The Statistics Act 1975 sets out the Government Statistician's role in, and responsibilities for, all official statistics • To meet its responsibilities under the Act, Statistics New Zealand's main roles are to; • Provide leadership for New Zealand's official statistics. • Be the key contributor to the collection, analysis and dissemination of official statistics relating to New Zealand's economy, environment and society. • Build and maintain trust in official statistics. • Ensure that official statistics are of high integrity and quality and are equally available to all.
Top Down Review • Statistics NZ, Treasury and State Services Commission participated in a review of New Zealand’s official statistics system • Main initiatives to come out of this review • Establishing a new model for official statistics • Leadership by the Government Statistician • Monitoring respondent burden across Government • Establishing an Independent Statistical Advisory Committee • Establishing a research data archive
Compliance Costs of Surveys • Statistics NZ is acutely aware of the compliance burdens facing our survey respondents • Because of New Zealand’s small size even medium sized business can be key contributors in sample surveys • Some industries are surveyed more intensely than others • Some ballpark figures that relate to Statistics NZ’s direct surveying activity • 130000 enterprises directly surveyed each year across 32 surveys • Paper forms average between 25 and 30 minutes to complete • Approximately 60000 hours or 7500 working days or 50 person years!!
Compliance Reduction Strategies • Small businesses • Reduce compliance through use of administrative data • Simple standard XBRL based templates • Large businesses • Tailored collection options • XBRL Initiators • Medium businesses • Easy to supply options from standard business records • XBRL omnibus reporting for multiple surveys
Financial Data Collections • Financial data is mostly collected to produce National Accounts statistics which are based around an International Framework • The Annual Enterprise Survey is the largest comprehensive annual financial survey of New Zealand businesses. • 20500 direct survey units supplemented by 225000 IR10 units • Collects income, expenditure and balance sheet information from industry groups within the economy • Less detailed subannual financial information collected by industry (manufacturing, retail and wholesale)
Accepting Alternatives to the Questionnaire • The primary source for direct survey data is paper forms • The two main alternatives are electronic reports and hardcopies of accounts • Accounts are often actively solicited from potential non-respondents in order to achieve corporate response rates • Electronic reports are most often MS Excel spreadsheets • Often larger respondents reporting for a number of survey units • Statistics NZ has strict guidelines on the acceptance of electronic data in terms of both security and authentication • Also take data over the phone and sent by email
Problems Accepting Ad Hoc Formats • Accounts • High internal processing overhead • Do not always match survey variables • Consolidation issues • Spreadsheets • Often have unique layouts and formats • Need to be customised by Statistics NZ to fit into predefined bulk loading processes • Not all questions answered (eg GST, reporting period) • Phone and email • Often unstructured and has gaps • More likely to be an estimate or a guess • Email poses security risks
XBRL Environment • Compliance cost • International Accounting Standards • Mandatory in NZ from December 2007 • Early adoption from December 2005 • Increasing number of offshore collection units • New Zealand as a branch office • Cross Agency reporting • Opportunity for single point reporting - IRD, CO, NZX, etc
XBRL - Benefits for Data Suppliers • Assuming that ... • XBRL is integrated with accounting/reporting software • Everyone is using the same taxonomies • Information may only need to be rendered once • A single report could meet the requirements of multiple agencies • The effort required to produce reports could be greatly reduced • After initial set up reports could be generated automatically • Changes in Statistics NZ requirements could feed through automatically to collections
XBRL - Benefits for Statistics NZ • Timeliness • Data could be made available right at the end of the reporting period • Transparency • Know exactly what items have contributed to particular variables • Lower processing costs • No longer structure or format dependent • New statistics without surveying • Low level data could be reassembled to meet different needs • More consistent data • Automation of data supply eliminates human error • Coherence at the unit record level
Taxonomies • Collection Taxonomies • Reuse of future Industry standard taxonomies, e.g. payroll • May be a government wide taxonomy • Total picture of requirements matched to what existing taxonomies can provide • Publishing Taxonomies • Will need to create a supplementary taxonomy for publishing statistical data • International taxonomies for national statistical agencies
Example - Quarterly Local Authority Survey • Currently a spreadsheet completed by Auckland City Council • 3.5 hours to complete • 44 variables based on accounting items from both the Income and Expenditure, and Fixed Asset schedule • Not including comments and other metadata • IT service provider :UBMatrix Wiztech • providing XBRL expertise • Auckland City Council - SAP/excel to XBRL • Statistics NZ - XBRL to Sybase
How the Exchange Might Work • Auckland City Council provides an Excel output from SAP • 2002/3 data • Excel tagged as XBRL and an instance document generated • Instance document sent to Statistics NZ via StatsGate • StatsGate is a pre-existing secure data lodgement facility • Instance document unravelled and loaded to Sybase • Sybase table planned to be the single data entry point for survey systems to interact with
What We Have Learned So Far • Receiving electronic files is relatively straight forward • It’s something we do already • A fully automated end to end process is not likely in the short term • There is a significant overhead associated with supplementing the existing taxonomies with Statistics NZ elements • Of the 44 variables 24 had to be defined separately as Statistics NZ elements • These 24 are spread evenly through income, expenditure and fixed assets • Some financial surveys may be more suited to XBRL sourced data than others • Balance of Payments vs Quarterly Local Authority Survey
Supplementary Taxonomy • A hypothetical example of how Statistics NZ data requirements may not match IFRS/NZ GAAP
XBRL - One Mode of Many • Statistics NZ will still receive paper questionnaires • Along with XBRL Statistics NZ may receive other electronic modes • Spreadsheets designed by Statistics NZ in a tailored environment • Internet forms • Telephone interviewing • Regardless of the mode Statistics NZ wants to have one inwards data flow • XBRL may provide Statistics NZ with a better way of integrating data from multiple sources • XBRL tags could potentially be applied to statistical output data from all sources
Issues We are Still Thinking About • Uptake – How can we promote XBRL • SMEs versus larger businesses • Financial software packages • Fully automated transactions • Moving towards meeting statutory obligations online • Mode effects • More accurate data may result in revisions to time series
Statistics NZ’s and XBRL • Continue building a picture of our future Data Collection environment • Identifying critical implementation issues • Realising XBRLs potential to meet our collection challenges • Collaboration • Common taxonomy across Government • Collaborate with other statistical agencies XBRL potentially offers so much in terms of reduced compliance costs, transparency, accuracy and timeliness.