Download
1 / 12
130 likes | 424 Views
IV. Ultraviolet Spectroscopy. Spectroscopy review: IR M olecular vibrations Information about bonding (functional groups) NMR Nuclear spin transitions Electronic/molecular environment of nuclei (C-H framework) MS Bombard with electrons to fragment Masses of molecular ion and fragments.

E N D
IV. Ultraviolet Spectroscopy • Spectroscopy review: • IR • Molecular vibrations • Information about bonding (functional groups) • NMR • Nuclear spin transitions • Electronic/molecular environment of nuclei (C-H framework) • MS • Bombard with electrons to fragment • Masses of molecular ion and fragments
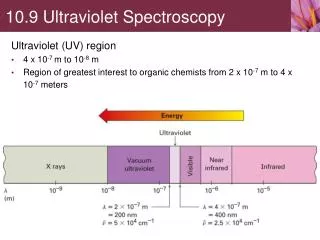
UV Spectroscopy • UV Spectroscopy • Electronic transitions of conjugated systems • Length and structure of conjugated part of molecule • Less common than other spectroscopy • More specialized information • UV region = most commonly 200-400 nm • Visible = 400-800 nm • UVA = 400-315 nm • UVB = 315-280 nm • UVC = below 280 nm • Wavelength absorbed by molecule determined by energy differences in p orbitals
UV Spectroscopy • p electron excited from HOMO into higher energy LUMO • p → p* transition • Longer wavelengths from lower E absorption
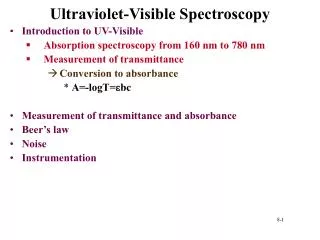
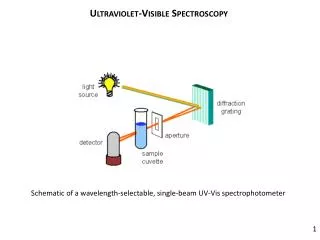
UV spectrum • Dissolve sample in solvent • Put in quartz cell • Reference cell (solvent only) • Spectrometer compares intensity of light transmitted through sample cell to light through reference cell • (Beer’s Law) • e = molar absorptivity (measure of strength of absorption) • b = pathlength of cell (usually ~1 cm) • c = concentration in mol/L
UV Spectrum • 1,3-Butadiene:
b-carotene • Absorbs at 454 nm • Blue visible light • Appears orange (carrots) • White light – blue = orange
UV Spectroscopy • Correlation between structure and wavelength:
UV Spectroscopy • Predicting maximum wavelength: • Woodward-Fieser rules • Very specific and lots of them! • Some generalizations: • Add ~40 nm for each C=C • Add 5 nm for each extra R group on C=C • Examples:
Vitamin D • Two related compounds • Cholecalciferol (D3) and ergocalciferol (D2) • Steroid derivatives; differ in side chain structure • Function = increase absorption of Ca • Deficiency • Poor bone growth • Rickets in children • Osteoporosis in adults • Vitamins not found in food; precursors are • D3 precursor: found in dairy and fish • D2 precursor: found in some vegetables • Conversion to D3 and D2 initiated by UVB sunlight (l = 295-300 nm)
Vitamin D • First step: electrocyclic ring opening • Conrotatory or disrotatory? • How should H be drawn on C marked with *? • Second step: spontaneous thermal sigmatropic shift • Where did H go? • What type of shift? • Products further oxidized to active forms in kidney and liver *