Download
1 / 37
370 likes | 755 Views
Introduction to Future Technology Transformations FTT(1). Pim Vercoulen p.vercoulen@student.ru.nl May 19 th , 2018 ASSIA office Nagoya University 名護多大学. Background. Framework developed by Jean-François Mercure ( currently professor at Radboud University, Nijmegen, The Netherlands).

E N D
Introduction to Future Technology Transformations FTT(1) Pim Vercoulen p.vercoulen@student.ru.nl May 19th, 2018ASSIA officeNagoya University 名護多大学
Background • Framework developedby Jean-François Mercure (currently professor at Radboud University, Nijmegen, The Netherlands). • FTT:Power (2012, Jean-François Mercure) We’llworkwiththis model • FTT:Transport (2015, Aileen Lam) • FTT:Heat (2017, Florian Knobloch) • FTT:Steel (~2018, Lorena van Duuren & Pim Vercoulen) More on this later • FTT:Agriculture (~2018, SörenLinder) • FTT:Cement (t.b.a.) • Innovationeconomics • Bottom-up approach
Application of FTT (coupledto E3ME) • Fuelling Europe’s Future: How the transition from oil strengthens the economy (FTT:Transport) • Analysis of tariffs on solar panels fromtheTrumpadministration (FTT:Power) • Workdoneforthe European Union: • Case study on R&D and spillovers on clean energy technologies(FTT:Power) • Case study on assessing the impacts of selected EU policies promoting clean energy finance (FTT:Power) • Report on a simulation model for technological change in the residential heating sector (FTT:Heat) • Workcurrentlybeingdonefor India • Contributionsto “Renewable Electricity Roadmap 2030 for India” (FTT:Power)
Innovationeconomics • FTT framework is based on innovationeconomics (=Schumpetereconomics) • Learning rate • S-curve • Whyinnovationeconomics: “Firstly, it is the application of technology that has caused the anthropogenic contribution to climate change in the historical context; both coal and oil were part of processes of transformations of economies and societies. Understanding the history of technology then helps us to direct the course of future technical change. Secondly, a change to a low carbon society will require widespread development and mass deployment of new, low carbon technologies” (Köhler, et al. 2006) • The bottom-up schumpeter approach works well withthe top-down post-Keynesian approach Global Energy Assessment Ch1 Energy Primer p113 (2012) Nakicenovic, Technology Forecasting and Social Change (1986) E.M. Rogers, Diffusion of Innovations, Fifth Edition p281 (2010)
FTT-E3ME feedbacks Post-Schumpeterian (evolutionary) ・Fuel/Material consumption ・Investment in new production technology ・product price ・product demand ・Fuel/Material demand E3ME FTT Post-Keynesian =
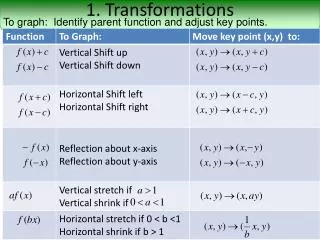
General FTT Methodology – LevelizedCost • Price of commodity based on LevelisedCostcalculation Costs are notperfectlydefinedsincethere are regionalvariancesthatcan affect thecosts as experiencedbytheinvestor
General FTT Methodology – Preference Matrix • Preference matrix • Probility of aninvestorchosingfortechnologyi or j • Standard deviation of preference (dFij) • Preference FA->B
General FTT Methodology – Share changes • As a result of the LC, we get investorpreferences (Fij), and as a result of investorpreferences we get market share changes (ΔSi->j)
Policy instruments Policieseither affect thecost of production or regulatecertaintechnologiesand these willbereplacedbyothertechnologies • FTT:Steel • Subsidy / tax on investment costs • Subsidy / tax on materialcosts • Regulations • Exogenous share additions • Demandandscrap availability management • FTT:Heat • Subsidies • Feed-in-tariff • Fueltaxes • Access tofinance • Exogenous share additions • Regulations • Heat demand management • FTT:Power • Subsidy / tax on investment costs • Feed-in-tariff • Regulations • Exogenous share additions • Electricity demand management and storage • FTT:Transport • Vehicle taxes • Fueltaxes • Road taxes • Biofuelmandate • Registration carbon tax • Regulations • Exogenous vehicle additions
FTT:Steel – Scope • A deepunderstanding of the sector is required • What is covered in the model: • Levelisedcost of steelmaking (LCOS) is compared on the basis of crude steel production Hot rolling • Input of rawmaterials • Coal • Natural gas • Electricity • Iron ore • Limestone • Biomass • Precursor steps: • Coking • Sintering • Pelletizing • Ironmaking • Blast furnace • Direct reduction • Smelt reduction • Hydrogen flash smelt • Steelmaking • Open hearthfurnace • Basic oxygenfurnace • Electric arcfurnace • Molten oxide electrolysis • Whatelse?: • The input of materialscanvary (e.g. scrap input versus self-produced iron input) • Plant configurationscanvary (e.g. size, efficiency, etc.) • Discrenpanciesamong sources Cold rolling Crude steel Casting • Input of rawmaterials • Scrap
FTT:Steel – Data acquisition (work-in-progress) • Historical steel productionis recordedbythe World Steel Association (~1970-2017) • …but does notcontaintheresolutionneededforthisstudy • Historical emissions from the iron and steel industry are recorded by the Joint Research Centre of the European Commission (EC-JRC) (1970-2012) • …but only total emissions and not on technology-specific level • Material use was gathered from multiple sources and these show great variations • In different regions different materialqualities are available • E.g. in Chinese reserves of iron ore andcoal are usually of lowerqualityandthereforeconsumegreaterquantities • Materialuse over time changed, i.e. efficiency increased • …but no good source of historicalmaterialuse was found
FTT:Steel – Data acquisition (work-in-progress) • Technology specificcostaspectsvariedaccross sources • Investment costs of existingtechnologiesweremainlyobtainedfrom IEA-ETSAP and IETD-IIP • Not on a regional basis duetolimitation of sources andduetotheassumptionthatitwouldvarylittleamongcountriessinceonly a few engineering companies are available of steel plant construction • Operationand maintenance was made variablealongwithmaterialconsumption • Technologicalspecificationsof noveltechnologies • Based on scientific papers that serve as a proof of concept of technology, but how are costsestimated?
FTT:Steel – Variablematerial input • Coalqualitycan affect theamount of coaland coke consumed • Iron ore quality (i.e. iron content) affectstheamount of iron ore consumed • Scrap is usually co-meltedforqualityinsuranceandtosuppresscosts • …but scrap is notalwaysavailable • …but scrapqualitycanvary (even tothe point whereit is rendereduseless • How does FTT:Steelcalculatematerialconsumptionforeach time iteration? Input-Output ! Identity matrix IO-tableFinaldemand vector
FTT:Steel – Scrap Availability • Scrap availability is proportionalto steel stocks within different sectors • …but steel becomes available as scrap after the EOL • …and different sectors use different steel qualities and coatings which could render it unsuitable as steel scrap
FTT:Steel – Description of the Chinese steel industry • Steel production in 2014: • 93% throughthe BF-BOF route • 7% throughtheScrap-EAF route • It is probablethatothertechnologies, such as DRI-EAF and SRI-BOF are present as well, but no quantitative sources • Scrap availability is limited in China • Policies in China • Steel industry (usedtobe) subsidised Implementation in FTT? • Merging smaller companies intobiggerones, i.e. increasing efficiency • Low quality of coaland iron ore
FTT:Steel – Description of theJapanese steel industry • Steel production in 2014: • 77% throughthe BF-BOF route • 23% throughtheScrap-EAF route • Corex (SRI-BOF) is used in Japan, but no quantitative data (yet) • No DRI-gas – EAF, because no natural gas • Scrap availability is sufficientto feed scrap-EAF route • Policies in Japan: • COURSE50
FTT:Steel – Description of theKorean steel industry • Steel production in 2014: • 64% throughthe BF-BOF route • 33% throughtheScrap-EAF route • 0,7% Corex (SRI-BOF) limited data • 1,4% Finex (SRI+ -BOF) limited data • Scrap availability is sufficientto feed scrap-EAF route • Policies in Korea: • Consideringtoimplement ETS
FTT:Steel – Description of the Taiwanese steel industry • Steel production in 2014: • 59% throughthe BF-BOF route • 41% throughtheScrap-EAF route • Scrap availability is sufficientto feed scrap-EAF route • Policies in Taiwan: • Energy Tax Act (drafting)
FTT:Steel – Examples of preliminaryresults • Development over time of the LCOS in China • From ±2037 Scrap-EAF becomesthecheapest route, because of anincrease of scrap availability
FTT:Steel – Examples of preliminaryresults • Development over time of the LCOS in Japan • Scrap-EAF alwaysthecheapesttechnology, but increasesslightlybecause of a decrease in scrap availability
FTT:Steel – Examples of preliminaryresults • Development over time of the LCOS in Korea • Conv. BF-BOF is thecheapesttechnology. This is unlikely, so data optimisation is needed! • (Even Conv. BF-OHF is cheaperthan most technologies!)
FTT:Steel – Examples of preliminaryresults • Development over time of the LCOS in Taiwan • Same story as Korea
FTT:Steel – Anyrecommendations? Ifanyone has anyrecommendations, questions, or remarksregardingFTT:Steelplease let me know
FTT:Power as anexample – 1 • A deepunderstanding of the power sector was requiredto set up the model • Manytechnologiesexist, but they are notalwayseasilyinterchangeble! • Baseload load technologies (Coal-, Nuclear-, Geothermal-basedtechnologies, etc.) • Flexible load technologies (Oil-, Natural gas-, Hydro-basedtechnologies, etc.) • Variable load technologies (Solar-, Wind-, Wave-basedtechnologies, etc.)
FTT:Power as anexample – 2 • Under the baseline scenario of FTT:Power, renewables do notgain a significant market share • Emissionswill continue torise • Policies are neededtoincentiviserenewablesandperhapstopenalisefossiltechnologies
How to run FTT in MATLAB • Change the MATLAB working directory tothe directory whereyouunzippedthe files • Type “FTT59x24v7Gui” in thecommand line • Thisshould open theGraphical User Interface • Click “Load History” • Select scenario and click “Calculate”
How to set policies • Sub: Subsidies on the capital cost of technologies (e.g. public-private partnerships). This is specified as a negative % of the capital cost • FiT: Feed-in tariffs are prices offered to producers for their electricity below market price. They are specified in $/MWh subtracted from the bare LCOE • Reg: Capacity cap in GW. When exceeded a phase-out is required. • DP: These are not quite policy instruments, but exogenous parameters, which can be related to policy. There are 4 of these: • MEDK: Electricity peak capacity demand to average capacity demand ratio (% = GWpeak/GWavg) • MEDD: Electricity peak demand to average demand ratio (% = GWh_peak/GWh_avg) • MEKS: Electricity storage generation capacity to total generation capacity (% = GWst/GWtot) • MEES: Electricity storage available to total electricity generation ratio (% = GWh_st/GWh_tot) • CO2P: Tax applied to emissions by electricity generators proportional to their emissions, in $/tCO2. • MWKA: Command and control government planning on electricity generation capacity, in which capacities are specified in GW per technology/country.
Genericassignment – Scenario 1 • Scope : Japan (No. 35) and China (No. 41) • Goal : Expandthe market share of CCS andbiomass • Policies • Tax on investment costs: • 25% forbiomasstechs (enter as: 0,25) • 50% for CCS techs (enter as: 0,5) • Regulations: • Coal: • Japan: 85 GW in 2018 and a 2 GW annualdecrease • China: 750 GW in 2018 and a 15 GW annualdecrease • EvaluateEmissions, Electricity Price, Market shares of CoalandRenewables (onlysolarand wind) • Realizethat changes occurduetotechnologicaldiffusionwhich are drivenbythe LCOE
Genericassignment – Scenario 2 • Scope : Japan (No. 35) and China (No. 41) • Goal : Incentivizerenewables (…and cheat a little bit) • Policies • Subsidies on investment costs: • 75% forallsolarand wind technologies (enter: -0,75) • Electricity storage tocapacity ratio (MEES and MEKS): • Japan: 1% in 2018. Let itincreaseby 2% annuallyuntil 50% is reached • China: 30% in 2018. Let itincreaseby 0,25% annually • EvaluateEmissions, Electricity Price, Market shares of CoalandRenewables (onlysolarand wind) • Realizethat changes occurduetotechnologicaldiffusionwhich are drivenbythe LCOE
Genericassignment – Scenario 1 – Outcome of policy portfolio
Genericassignment – Scenario 2 – Outcome of policy portfolio
Design yourown policy portfolio • Scope : Japan (No. 35) and China (No. 41) • Goal : Decarbonizethe power sectors of Japan and China by 50% by 2050 comparedto 2013±0,29 Gt/y for Japan in 2050±1,6 Gt/y for China in 2050 • Design yourown policy portfolio