Download
1 / 15
150 likes | 156 Views
Ventura County Traffic Model (VCTM) VCTC Update. April 6, 2018. VCTM– A Long History!. First VCTM developed in 1992 with updates and conversions throughout the years with the last update completed in 2009. Land Use Based (Building Square Footage and LU Acres)

E N D
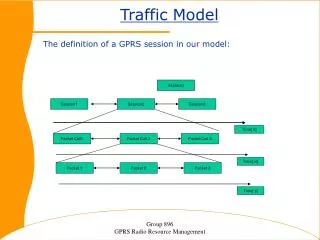
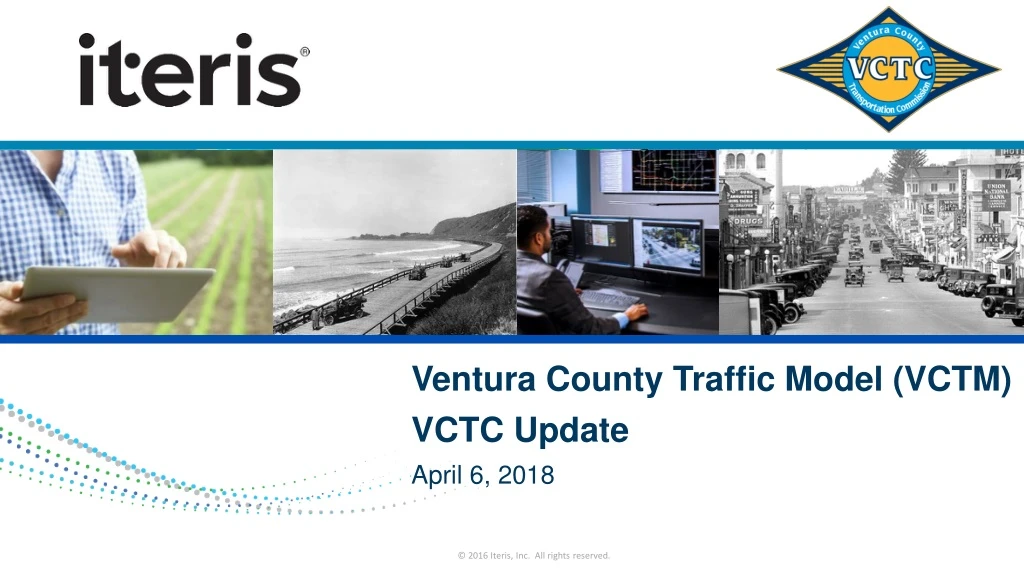
Ventura County Traffic Model (VCTM) VCTC Update April 6, 2018
VCTM– A Long History! • First VCTM developed in 1992 with updates and conversions throughout the years with the last update completed in 2009. • Land Use Based (Building Square Footage and LU Acres) • Autos only (No Transit or Goods Movement/HDT Component) • New VCTM developed to Meet Key Application Needs • Environmental Analyses • County General Plan Update • SB 743 • Impact Fee/Fair Share Needs • Next Generation of Local Models
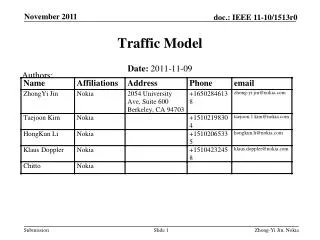
VCTM Consistency • VCTM must be consistent with SCAG 2016 Regional Transportation Plan (RTP)/Sustainable Communities Strategies (SCS) Regional Travel Demand Model • Subarea Model Development Tool • SCAG Zone Structure • 11,000+ zones – Used for trip distribution and mode choice • Full Model run time upwards of 7-10 days • VCTM • 663 Ventura County zones • Base Year 2012 – Forecast Year 2040 • 1,021 total zones • Full Model run time 13-15 hours.
Traditional Four-Step Model ProcessTries to Replicate Human Travel Behavior • Trip Generation • Do I make a trip? • Trip Distribution • Where do I go? • Mode Choice • What are my means of travel? • Assignment • What route do I choose?
Model Calibration & Validation(Comparing Model Outputs to Real World Counts) • What needs Calibration? • Trip Generation Rates and External Trips • Trip Distribution Parameters • Mode Choice Coefficients • Freeway and Arterial Street Validation Criteria • Count/Volume Comparison (FHWA & Caltrans) Freeways +/- 7% Major Arterials +/- 10% Minor Arterials +/- 15% • Percent Root Mean Squared Error (%RMSE ) Caltrans = 40 and FHWA = 30 • Coefficient of Determination (R2) (FHWA & Caltrans) 0.88 • Caltrans Standard Deviation >0.75 • Caltrans Criteria from the Caltrans Travel Forecasting Guidelines, November 1992 • FHWA Criteria from the TMIP Model Validation and Reasonableness Checking Manual
Model Outputs • Performance Measures • Assignment Loading (Volumes and Speeds) • Internal/External Origins & Destinations • V/C Ratios on Facilities • Heavy Duty Vehicle Volumes • Transit Ridership by Mode • Active Transportation Modes • Model Application • Functional Class Plots • With number of lanes • With Speeds • Volume to Capacity Plots • Air Quality Speed Bin Outputs • Automated Outputs • Vehicle Miles of travel • Vehicle Hours of travel • Vehicle hours of delay • All outputs developed for the following: • Ventura County, General Plan Districts, TIMF Districts, Cities • By Time of Day (AM peak period, Mid-day, PM peak period, Evening, Night) Performance Measures
AM Peak Period (6-9 AM) • 2012 Validation • VMT = 3,249,750 • VHT = 79,550 • VHD = 13,200 • Average Speed = 40.9 MPH • 2040 Baseline • VMT = 3,714,000 • VHT = 104,150 • VHD = 26,850 • Average Speed = 35.7 MPH
PM Peak Period (3-7 PM) • 2012 Validation • VMT = 5,090,500 • VHT = 129,300 • VHD = 24,100 • Average Speed = 39.4 MPH • 2040 Baseline • VMT = 5,717,150 • VHT = 163,200 • VHD = 42,900 • Average Speed = 35.0 MPH
Average Daily Traffic • 2012 Validation • VMT = 16,588,600 • VHT = 386,800 • VHD = 45,700 • Average Speed = 42.9 MPH • 2040 Baseline • VMT = 18,850,900 • VHT = 475,700 • VHD = 83,000 • Average Speed = 39.6 MPH
Average Daily Traffic (ADT) and Vehicle Hours of Delay (VHD) U.S. 101 80,497 (2040) 162,642 (2040) 157,805 (2040) 63,945 172,924 (2012) 150,622 (2040) (2012) 203,849 (2040) 146,252 (2012) 166,597 (2012) 191,821 (2012)
Vehicle Miles Traveled (VMT) by Speed • Increase in low speed VMT • Decrease in high speed VMT • Overall increase in VMT of 14% 2040
Mode Choice Outputs • Similar Mode Splits between 2012 and 2040 • Transit Trips 1 – 1.114% • Non-motorized Trips 4.79 – 5.0% • Increase in total number of trips • 3,220,374 (2012) – 3,780,041(2040)
Next Steps • Coordination with General Plan • US-101 HOV Lane • Local Applications and Updates
Ventura County Traffic Model (VCTM) VCTC Update April 6, 2018