Download
1 / 40
400 likes | 535 Views
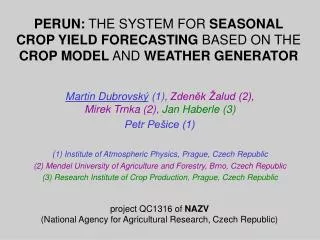
PERUN - The System for the Crop Yield Forecasting and Assessing Impacts of Climate Change. Martin Dubrovský (1) Zdeněk Žalud (2), Mirek Trnka (2), Jan Haberle (3), Petr Pešice (1). ( 1) Institute of Atmospheric Physics, Prague, Czech Republic

E N D
PERUN - The System for the Crop Yield Forecasting and Assessing Impacts of Climate Change Martin Dubrovský (1) Zdeněk Žalud (2), Mirek Trnka (2), Jan Haberle (3), Petr Pešice (1) (1) Institute of Atmospheric Physics, Prague, Czech Republic (2) Mendel University of Agriculture and Forestry, Brno, Czech Republic (3) Research Institute of Crop Production, Prague, Czech Republic
this presentation The stress is put on the methodology, not on the results !
PERUN =system for crop model simulations under various meteorological conditions • 1st version: developed within project “Prediction of yields of selected crops”(National Agency for Agricultural Research, Czech Republic; 2001-2002) • specific tasks solved by PERUN: • crop yield forecasting • climate change/sensitivity impact analysis • + some components of PERUN are used (NATO project) for assessing drought climatology (PDSI and SPI)
PERUN - components 1) WOFOST crop model(v. 7.1.1.; executable and source code provided by Alterra Wageningen) modification: Makkink formula for evapotranspiration implemented (motivation: Makkink does not need WIND and HUMIDITY data) 2) Met&Roll weather generator - Met&Roll = WGEN-like stochastic 4/6-variate daily weather generator; (Dubrovský, 1997) - 3 modifications were made (see the following slide) 3) user interface - input for WOFOST(• crop • soil and water • weather & climate • start/end of simulation • production levels • fertilisers ...) - launching the process(preparing weather series, crop model simulation) - statistical and graphical processing of the simulation output
Modifications of previous version of the4-variate Met&Roll generator (1)4-variate 6-variate:To generate all six daily weather characteristics required by WOFOST (PREC, SRAD, TMAX, TMIN, VAP, WIND), the separate module adds values of VAP and WIND to the previously generated four weather characteristics (SRAD, TMAX, TMIN, PREC) using the nearest neighbours resampling from the observed data. (2) The generator may produce series which consistently follow with the observed data at any day of the year. (3) The second additional module allows to modify the synthetic weather series so that it fits the weather forecast
skip learning sample: @DATE SRAD TMAX TMIN RAIN VAPO WIND ... xx001 1.6 1.3 -1.5 3.3 0.63 1.0 xx002 1.6 -0.8 -3.8 0.3 0.53 1.7 xx003 3.9 -2.3 -9.9 0.0 0.23 2.0 xx004 4.5 -2.3 -11.4 0.0 0.38 1.0 xx005 1.6 -6.1 -12.9 0.0 0.33 1.3 xx006 1.6 -1.8 -12.4 1.1 0.23 3.3 xx007 3.8 1.2 -2.3 0.0 0.52 4.7 xx008 1.7 -0.1 -4.3 0.0 0.39 1.3 xx009 1.7 -1.8 -6.7 0.4 0.42 4.0 xx010 1.7 -3.8 -8.0 1.0 0.36 2.0 xx011 1.7 0.0 -3.9 8.3 0.46 2.0 xx012 2.9 3.7 -0.3 2.8 0.57 1.7 xx013 1.8 2.6 -0.8 1.0 0.62 2.0 xx014 4.0 2.9 -3.3 0.0 0.45 2.7 xx015 4.0 2.4 -5.9 0.0 0.37 1.3 ... A) 4-variate 6-variate: 4-variate series: @DATE SRAD TMAX TMIN RAIN ... 99001 1.9 -2.7 -6.3 0.3 99002 2.1 -3.6 -3.7 0.7 99003 1.5 0.1 -1.3 2.4 99004 2.4 0.3 -2.7 0.6 99005 1.4 -1.4 -5.1 0.1 ... ... 6-variate series: @DATE SRAD TMAX TMIN RAIN VAPO WIND ... ... 99001 1.9 -2.7 -6.3 0.3 0.34 3.0 99002 2.1 -3.6 -3.7 0.7 0.28 3.0 99003 1.5 0.1 -1.3 2.4 0.61 3.0 nearest neighboursresampling 99004 2.4 0.3 -2.7 0.6 0.57 3.0 99005 1.4 -1.4 -5.1 0.1 0.47 3.0
skip B) series which consistently follow with the observed data
skip C) modification of the synthetic weather series so that it fits the weather forecast:
PERUN - output - summary statistics of the series of annual characteristics
PERUN - sensitivity analysis (day D0) - output (summary statistics)
seasonal crop yield forecasting1. construction of weather series
weather forecast is given in terms of: a) expected values valid for the forthcoming days(e.g., first day/week: 12±2 °C, second day/week: 7±3 °C, …) alternative formats of the weather forecast(useful in climate change/sensitivity analysis): b) increments with respect to long-term means (1st day/week/decade: temperature = + 2 C above normal; precipitation = 80% of normal; 2nd day/week/decade: ….., …. ) c) increments to existing series
a) weather forecast given in terms of the expected values * weather forecast random component METHOD = 1 ...averages... ..std. deviation.. @JD-from JD-to TMAX TMIN PREC TMAX TMIN PREC 99121 99130 17 6 30 2 2 10 99131 99140 14 4 60 3 3 20 99141 99150 21 10 10 4 4 10 @
b,c) increments with respect to the long-term means or w.r.t. existing series * weather forecast random component METHOD = 3 ...averages... ..std. deviation.. @JD-from JD-to TMAX TMIN PREC TMAX TMIN PREC 99121 99130 1 1 1.2 2 2 0.1 99131 99140 0 0 1.0 2 2 0.1 99141 99150 -1 -1 0.9 2 2 0.1 @
crop yield forecasting at various days of the year probabilistic forecast <avg±std> is based on 30 simulations input weather data for each simulation = [obs. weather till D−1] + [synt. weather since D ~ mean climatology) a) the case of good fit between model and observation site = Domanínek, Czech Rep. crop = spring barley year = 1999 emergency day = 122 maturity day = 225 observed yield = 4739 kg/ha model yield = 4580 kg/ha (simulated with obs. weather series) enlarge >>>
crop yield forecasting at various days of the yeara) the case of good fit between model and observation
crop yield forecasting at various days of the year b) the case of poor fit between model and observation site = Domanínek, Czech Republic crop = spring barley year = 1996 emergency day = 124 maturity day = 232 observed yield = 3956 kg/ha model yield = 5739 kg/ha (simulated with obs. weather series) enlarge >>>
crop yield forecasting at various days of the year b) the case of poor fit between model and observation
crop yield forecasting at various days of the year b) the case of poor fit between model and observation indicators task for future research: find indicators of the crop growth/development (measurable during the growing period) which could be used to correct the simulated characteristics, thereby allowing more precise crop yield forecast
climate change impact analysis:input weather series a) direct modification approach: present climate: observed weather series changed climate: observed weather series modified by climate change scenario b) weather generator approach: present climate: WG with parameters derived from the observed series changed climate: parameters of WG are modified according to the climate change scenario
climate change impact analysis:climate change scenario (based on GCMs) a) changes in the means of climatic characteristics b) changes in the WG parameters - including changes in variability, precipitation frequency, … - problem: reliability of daily outputs from GCMs @SCENARIO: ECHAM4, SRES-A2, high climate sensitivity; 2050 MONTH DTR PRE RAD TMN TMP TMX VAP WND --- + * * + + + * * 0 0.08 -0.6 2.2 2.99 3.01 3.07 18.8 0.2 1 -0.11 8.6 0.6 3.84 3.77 3.73 29.8 3.2 2 -0.08 12.6 7.9 4.51 4.44 4.44 35.6 4.5 3 0.06 8.4 6.0 3.42 3.38 3.48 23.8 3.3 4 0.34 -18.0 6.6 2.74 2.91 3.08 17.9 -3.4 5 -0.22 9.0 -5.2 2.18 2.01 1.96 13.5 1.8 6 -0.19 -2.7 -0.6 2.12 2.02 1.93 14.1 -0.3 7 0.24 -7.8 3.6 2.75 2.89 2.99 17.5 -4.8 8 0.61 -16.1 7.1 3.27 3.55 3.88 19.6 -9.7 9 0.00 10.3 -2.3 2.54 2.58 2.54 15.1 1.2 10 0.20 -6.2 4.8 2.52 2.59 2.73 15.4 2.0 11 0.06 5.4 5.9 3.17 3.18 3.23 23.1 1.1 12 0.02 -4.9 7.6 2.78 2.77 2.80 21.3 -2.5
climate change impacts - (multiple scenarios) summary statistics from 30-year series
tools for batch analysis • sensitivity analysis • multi-site analysis
PERUN - sensitivity analysis (soil) - output (summary statistics)
PERUN - sensitivity analysis (temperature) - output (summary statistics)
PERUN - sensitivity analysis (day D0) - output (summary statistics)
sensitivity analysis3 parameters are varied: soil - station - RDmax
multi-station analysis: input table # multi-station analysis @idx soil crop wea lat lon RDMsol 001 EC1.NEW BAakc.cab DOKS 50.2 14.3 100 002 EC2.NEW BAakc.cab LEDN 50.9 17.2 80 003 EC3.NEW BAakc.cab ZABC 48.1 15.2 130 004 EC5.NEW BAakc.cab ZATC 49.9 16.1 120 005 EC2.NEW BAakc.cab KROM 51.1 16.2 70 006 EC1.NEW BAakc.cab HOLE 49.1 15.6 90 . . . . ***
plans for future • implementation of other crop models:… CERES? • weather generator:other method for WIND & HUMID • crop yield forecasting:improve the forecast skill by finding indicators for statistical correction of model yields • new applications: • multi-site analysis: agroclimatic potential of Czechia (already running!) • climate change impacts: new scenarios • in other regions • … and improve programming (user interface, graphs, …)
ask me for the software demonstration …(if you are interested)
end dub@ufa.cas.cz www.ufa.cas.cz/dub/crop/crop.htm