Download
1 / 17
170 likes | 278 Views
Inferred accumulation and thickness histories near the Ross/Amundsen divide, West Antarctica. T. A. Neumann 1,2 , H. Conway 2 , S.F. Price 2 , E. D. Waddington 2 , D. L. Morse 3. 1 Department of Geology, University of Vermont 2 Department of Earth and Space Science, University of Washington

E N D
Inferred accumulation and thickness histories near the Ross/Amundsen divide, West Antarctica T. A. Neumann1,2, H. Conway2, S.F. Price2, E. D. Waddington2, D. L. Morse3 1Department of Geology, University of Vermont 2Department of Earth and Space Science, University of Washington 3Institute for Geophysics, University of Texas at Austin
Study Area from Morse et al. (2002)
5 MHz data 7 MHz data flow divide 1.5 / 1.0 MHz data Profile lengths ~ 200km
Univ. of WA radar system • ground-based system • mono-pulse transmitter (± 2000 V), 30 Hz • resistively-loaded dipolar antennas • digital oscilloscope records returned amplitude (mV) • returns stacked (~ 1000)to generate single trace • traces co-registered with GPS data. • Can cover (up to) 100 km day
‘Old Faithful’ ‘Old Faithful’ Byrd core site Byrd core site 1.5 MHz data 1.0 MHz data
Byrd core site Byrd core site ‘Old Faithful?’ 5 MHz data
Converting picked radar layers to depth-age estimates: 1. Pick radar layers 2. Determine two-way travel time of layer at each site. used Herron-Langway (1980) model for r(z); Looyenga’s equation. 3. Convert two-way travel time to depth at sites. 4. Determine layer age using ice core depth-age data. used data from Byrd cores [Hammer et al., 1994] and ITASE-00-1 [Dixon et al., 2004].
Tracking Layers: extend Byrd time scale 0 to 8.3 ka BP: 14 dated layers 8.3 to 17.5 ka BP: 1 layer (Old Faithful) • restrict analysis to most recent 8.3 ka estimate errors as ± 60 years near the surface ± 150 years for deepest point.
Accept combinations of: accumulation rate history Divide ice dynamics history ( H(t) and h(t) ) to match radar-derived depth-age relationship Apply method at three sites: Divide, SE and NW flanks Ice flow modeling 1-D transient model (Dansgaard and Johnsen, 1969) variable acc. rate, ice thickness, vertical velocity (h), and basal melt.
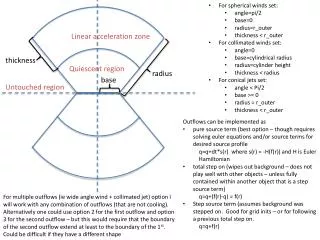
Divide: sensitivity to h h defines transition from constant to linear strain rate in Dansgaard-Johnsen (1969) model. h ~ 0.7 H at ice divides h ~ 0.5 H ‘near’ divides h ~ 0.2 H flank flow smaller h requires lower accumulation rate
Divide: sensitivity to H Steig et al. (2001) suggested up to 300m of thinning since LGM at Byrd. Huybrechts (2002) suggested up to 575m of thinning at Byrd. Thinning requires higher accumulation to match layer data.
divide SW Flank NE Flank Flanks: correction due to advection Use 2-D model (Price et al., 2004) to assess importance of acc. rt. gradient ice flow transports oldest particle (8.3 ka BP) ~13 km to flank sites Advection correction: reduces rate at SW flank increases rate at NE flank
4500 ka BP 8000 ka BP Spatial, temporal pattern modern spatial pattern h = 0.2, 0.5, 0.7 H(t) at divide Suggests either: basal ice is sliding, divide has been unstable, or both SW Flank NE Flank
Spatial, temporal pattern melting is likely if Q > 70 mW/m2 Morse et al., 2002 sliding changes vertical velocity profile, reduces h. Pettit et al., 2003 h ~ 0.2 H(t) may be appropriate at divide accumulation rate was similar to today8 ka BP, but 30% higher than present from 5 to 3 ka BP. consistent with Siegert and Payne (2004) and Goodwin (1998)
Conclusion: Accumulation rate 30% higher between 5 and 3 ka BP. dependent on Byrd time scale; check back in 2008 using new core results Thanks also to Raytheon and 109th ANG for field support. Funding provided by NSF-OPP
Profile along L1 15:1 aspect ratio
Ross Sea Amundsen Sea Profile along L2 10:1 aspect ratio