Download
1 / 109
1.35k likes | 1.79k Views
Update on EDIC: Epidemiology of Diabetes Interventions and Complications Study . Charlotte McDonald, MD, MSc, FRCPC Associate Professor, Division of Endocrinology, Department of Medicine, UWO. DCCT/EDIC 30th Anniversary Symposium Contributions and Progress. DCCT/EDIC Research Group

E N D
Update on EDIC: Epidemiology of Diabetes Interventions and Complications Study Charlotte McDonald, MD, MSc, FRCPC Associate Professor, Division of Endocrinology, Department of Medicine, UWO
DCCT/EDIC 30th Anniversary Symposium Contributions and Progress DCCT/EDIC Research Group June 22, 2013 DCCT/EDIC
Acknowledgements EDIC Executive Committee • Patricia Cleary, MS • John Lachin, ScD • Catherine Cowie, PhD • David Nathan, MD • Saul Genuth, MD • Rose Gubitosi-Klug, MD, PhD • Bernard Zinman, MD • Meg Bayless, BSN, RN, CDE, CCRC • Gayle Lorenzi, RN, CDE 30th Anniversary Slides • David M. Nathan, M.D. Co-Chair • Retinopathy: Lloyd Paul Aiello, MD, PhD PI, Joslin Diabetes Center • Nephropathy: Ian H. de Boer, MD Investigator, University of Washington • Neuropathy: Catherine Martin, MS, RN, BC-ADM, CDE Study Coordinator, University of Michigan • Cardiology: John M. Lachin, Sc.D. Principal Investigator DCCT/EDIC Data Coordinating Center,TheBiostatistics Center, The George Washington University • Rose A. Gubitosi-Klug, MD, PhD Principal Investigator DCCT/EDIC Clinical Coordinating Center
EDIC TEAM: UWO John Dupre, MD, FRCP, FRCPC, FACP Principal Investigator DCCT/EDIC University of Western Ontario Judy Harth, RN and Marsha Driscoll, RN: EDIC Study Coordinators UWO Debra Nielsen Robarts Research Institute
EDIC TEAM: UWO John Dupre, MD, FRCP, FRCPC, FACP Principal Investigator DCCT/EDIC University of Western Ontario Research Reports: 219 Other Peer Reviewed Publications: 91 Abstracts: 250 Total Publications: 560 DCCT/EDIC
DCCT/EDIC Timeline Feasibility • N=1,441 • ages 13 to 39 • 29 centers US and Canada • Diabetes duration 1 - 15 years National Commission National Commission RFA RFA RFA Planning Planning Feasibility DCCT end DCCT end EDIC start EDIC Recruitment 1978 1982 1983 1989 1993 1994 2005 2013 2016 DCCT EDIC 20 years 10 years DCCT/EDIC
CLINICAL CENTERS 1983-93 l l l l l l l l l l l l l l l l l l l l l l l l l l l l l l DCCT/EDIC
Discovery of Insulin (1921-1922) • Insulin prevented acute death • Chronic, incurable illness • Most develop end-organ complications Banting and Best
Insulin Era: 1930-1970 Long-term Complications: Steno Hospital Visual impairment (legal) 14% Blindness (total) 16% Renal failure 22% Stroke 10% Amputation 12% Myocardial infarction 21% • Death with or from hypoglycaemia was more common than death in ketoacidotic coma. • Clinical manifestations of late diabetic complications were considerably less common in patients who were still alive after >40 years of diabetes than in patients who died before their fortieth year of diabetes. 31% Mortality increased 2-6 fold compared with age-matched non-diabetic population Diabetologia 1978;14:363
DCCT: Major Study Questions • Primary prevention: Will intensive therapy prevent the development of retinopathy • Secondary Intervention: Will intensive therapy reduce the progression of retinopathy compared with conventional therapy?
Study Cohorts Age 13-40 Primary prevention (n= 726): 1-5 years duration No retinopathy or microalbuminuria Secondary intervention (n= 715): 1-15 years duration > 1 microaneurysm, < severe NPDR <200 mg albumin excretion/24 h
DCCT • Intensive Regimen • >3 daily injections • or CSII (pump) • >4 SMBG • Pre-meal BG • (3.9-6.7 mmol/L) • Post-meal • (<10 mmol/L) Glycemic Results 2% • HbA1c <6.05% DCCT Research Group NEJM 1993;342:381
Completeness of Follow-up DCCT BaselineStudy End (1993) Number 1441 1422 Percent of 100 99 DCCT cohort
DCCT Retinopathy Results: > 3 Step Change Primary Prevention Secondary Intervention 54% 76% DCCT Research Group NEJM 1993;342:381
Reduction in Complications: Intensive vs Conventional Development Retinopathy Nephropathy Neuropathy 3-step progression Severe NPDR Microalbuminuria Albuminuria Clinical Percent Reduction DCCT Research Group NEJM 1993;342:381
Summary Intensive Therapy Achieved mean HbA1c substantially (2%) lower than conventional therapy, albeit not in the non-diabetic range, with consistent major beneficial effects on early microvascular complications
Relationship between Glycemiaand Complications Risk of Retinopathy Progression 16 Intensive 14 • Risk Gradient: • ~44 % reduction in risk • per 10% lower HbA1c 12 10 Conventional 8 Rate per 100 PYR 6 4 2 0 5 6 7 8 9 10 11 12 13 Mean HbA1c (%) During DCCT DCCT Research Group Diabetes 1995;44:968
Risk of Severe Hypoglycemia RR= 3.3 Per 100 Pt-Yr 3-fold increase hypoglycemia, including coma /seizure mean wtgain 4.6 kg RR= 3.0 Rate of Severe hypoglycemia Rate of Coma or Seizure Diabetes 1997;46:271-86
Risk of Retinopathy Progression vs Mean HbA1c during DCCT 16 100 14 Intensive 12 • Risk Gradient: • ~44 % reduction in risk • per 10% lower HbA1c 80 Intensive 10 60 Conventional 8 Rate per 100 PYR Rate per 100 PYR 40 6 Risk of Severe Hypoglycemia 4 20 Conventional 2 0 0 5 6 7 8 9 10 11 12 13 5 6 7 8 9 10 11 12 13 Current Hemoglobin A1c (%) Mean HbA1c (%) During DCCT
Effect of INT vsCONV Therapy on Residual Insulin Secretion Although insulin secretion decreased in all subjects over time, intensive therapy reduced rate of decline. At baseline 303 subjects with stimulated C-peptide 0.2-0.5 pmol/L &duration 1-5 years Intensive Conventional Ann Int Med 1998;128:517-23
Major Scientific and Clinical Results of DCCT • Salutary effect of intensive therapy on earlymicrovascular and neurologic complications • Established association and primacy of glycemia and complications • Identified risks (hypoglycemia/weight gain) and costs and contrasted them with benefits • No adverse effects of INT on quality-of-lifeor cognitive function • 75 publications and ~150 abstracts
Epidemiology of Diabetes Interventions and Complications A Long-term Observational Study of the Diabetes Control and Complications Trial Cohort DCCT cohort too young (34 y at study end) and too brief duration of DM (12 y at end) to be at risk for CAD or more severe microvascular complications EDIC would allow study of macrovascular and more severe microvascular complications DCCT/EDIC
Major Objective To examine the longer-term effects of Intensive vs Conventional therapy implemented during the DCCT on the development and progression of more advanced stages of retinopathy, nephropathy, and neuropathy, and of CVD. EDIC Research Group Diabetes Care 1999;22:99 DCCT/EDIC
Completeness of Follow-up DCCT EDIC BaselineStudy EndBaseline(1993) (1994) Number 1441 1422 1394 Percent of 100 99 96 DCCT cohort DCCT/EDIC
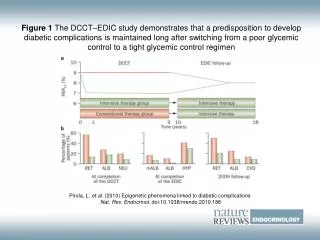
Metabolic Results: Median HbA1c Training DCCT Intervention At the end of the DCCT, all participants were offered training in intensive therapy and The clinical care of the DCCT participants was returned to their own health care providers * * * * * P< 0.05 Intensive EDIC mean 7.9% 1993- 1994 1 2 3 4 5 6 7 8 9 10 11 12 13 14 15 16 17 18 DCCT EDIC DCCT/EDIC
Metabolic Results: Median HbA1c Training DCCT Intervention EDIC Observation Conventional EDIC mean 8.0% * * * * * P< 0.05 Intensive EDIC mean 7.9% 1 2 3 4 5 6 7 8 9 10 11 12 13 14 15 16 17 18 DCCT EDIC S t u d y Y e a r DCCT/EDIC
Effect of DCCT Intensive Therapy after 4 Years of EDIC Follow-up Discovery of Metabolic Memory % Reduction in Risk with Intensive Therapy DCCT Retinopathy 3-step worsening 52 Proliferative 47 Macular edema 26 Laser Therapy 56 Nephropathy Microalbuminuria (>40mg/24h) 39 Albuminuria (>300 mg/24h) 54 EDIC Year 4* 63 55 73 62 53 84 Metabolic memory appears to persist for at least 10 years after end of DCCT for retinopathy, nephropathy, and neuropathy *In subjects free of complication at end of DCCT DCCT/EDIC DCCT/EDIC Research Group N Engl J Med 2000; 342:381-9
Cardiovascular Events Non-Fatal MI, Stroke or CVD Death Prior to 2005, we demonstrated reduction in atherosclerosis (carotid and coronary) in intensive therapy and association with HbA1c 0.12 0.10 0.08 Cumulative Incidence Risk reduction 57% 95% CI: 12, 79 Log-rank P = 0.018 0.06 Conventional 0.04 0.02 Intensive 0.00 0 1 2 3 4 5 6 7 8 9 10 11 12 13 14 15 16 17 18 19 20 21 Years from Study Entry Number at Risk Intensive: 705 686 640 118 Conventional: 721 694 637 96 DCCT/EDIC DCCT/EDIC Research Group N Engl J Med 2005; 353:2643-53
Completeness of Follow-up DCCT EDIC BaselineStudy EndBaselineYear 11Year 18 (1993) (1994) (2005) (2012) Number 1441 1422 1394 1340 1272 Percent of 100 99 96 93* 88+ DCCT cohort *96% of surviving cohort +95% of surviving cohort DCCT/EDIC
Major Scientific and Clinical Results of EDIC • Durability of intensive therapy effect including metabolic memory • Beneficial effect of Intensive therapy on longer-term clinical outcomes • More advanced complications • Atherosclerosis and CVD events • Safety-cognitive function unaffected despite hypoglycemia DCCT/EDIC
60 50 40 30 20 10 0 3 9 7 1 5 13 17 31 11 21 25 23 29 15 19 27 Duration of Diabetes (Years) Long-term Outcomes of Type 1 Diabetes Pittsburgh EDC DCCT Intensive Therapy Population-based Proliferative retinopathy Nephropathy CVD The frequencies of serious complications in patients with T1DM, especially when treated intensively, are lower than that reported historically. 44 19 20 8 12 8 30-year Cumulative Incidence ~1980-2008 DCCT/EDIC DCCT/EDIC Arch Int Med 2009;169:1307
Prevalence (%) of Severe Complications Steno 1978 DCCT INT 2008 Complication Blindness 30 Renal failure 22 Amputation12 1* 1† 1+ *<20/200 either eye †SeCr> 2, dialysis, or transplantation +All were of toes except one BKA Arch Int Med 2009;169:1307 Diabetologia 1978;14:363
DCCT Clues to Metabolic Memory Retinopathy • 53% increased risk in retinopathy progression for every 1% higher screening A1c, suggesting effect of prior glycemia • 3 to 4 year delay in demonstration of a beneficial effect of INT versus CONV therapy in primary prevention cohort
Further Retinopathy Progression over 10 years of EDIC from the Level at DCCT Closeout Adjusted For DCCT Closeout Level 60 53% Risk Reduction P < 0.0001 CONV 50 40 Cumulative Incidence % INT 30 20 10 0 0 1 2 3 4 7 8 5 6 9 10 Arch Ophthal 2008 126:1707-1715. EDIC Year DCCT/EDIC
Benefits of DCCT Intensive Therapy on Microvascular Outcomes During EDIC Percent Explained By Group Differences in DCCT HbA1c % Risk % Outcome Reduction Explained Further Retinopathy Progression: at 4 years 70% 97.7% at 10 years 53% 89.3% at 18 years 46% 86.7% DCCT/EDIC
Retinopathy Update Summary • Intensive therapy reduced development and progression of early retinopathy during the DCCT • INT had a profound reduction in risk of further progression during EDIC (metabolic memory) • Further EDIC follow-up has demonstrated a consistent beneficial effect on severe eye disease • Even though the risk reduction has decreased with time, the effect is still substantial after 18 years of EDIC follow-up DCCT/EDIC
Retinopathy Update Summary • During EDIC, there was a major (48%) reduction of risk of ocular surgery in the original INT group • In the original INT group, the incidence of severe retinal outcomes was reduced by 50% over the DCCT/EDIC period. DCCT/EDIC
Cumulative Incidence of Microalbuminuria During EDIC 25 Years 1-8 Conventional 20 57% risk reduction p < 0.0001 15 Cumulative Incidence (%) 10 Intensive 5 0 1-2 3-4 5-6 7-8 JAMA 2003; 290:2159-2167 EDIC Year EDIC
Cumulative Incidence of Macroalbuminuria during EDIC 12 Years 1-8 10 84% risk reduction p < 0.0001 Conventional 8 Cumulative Incidence (%) 6 4 2 Intensive 0 1 - 2 3 - 4 5 - 6 7 - 8 EDIC Year JAMA 2003; 290:2159-2167 EDIC
Reduction of Risk for Albuminuria with Intensive Diabetes Therapy Summary EDIC Y 1-8 EDIC Y 1-18 EDIC Y 1-8 EDIC Y 1-18 DCCT DCCT DCCT/EDIC
Cumulative Incidence of Hypertension DCCT/EDIC Arch Intern Med 2008; 168:1867-1873
Cumulative Incidence of Impaired GFR Sustained eGFR <60 ml/min/1.73m2 50% risk reduction P=0.006 DCCT/EDIC NEJM2011; 365:2366-2376 NEJM 2011
Intensive therapy also reduced the risk of more severe kidney disease DCCT/EDIC
Effects of Intensive Therapy on Kidney Disease Summary • During the DCCT, intensive therapy reduced the risks of developing micro- and macro-albuminuria • Over long-term EDIC follow-up: • The benefits on new albuminuria persisted (“metabolic memory”) • Development of hypertension delayed • Glomerular filtration rate preserved • Effects mediated by level of glycemia DCCT/EDIC
Effects of Intensive Therapy on Kidney Disease Conclusion Early intensive diabetes therapy is effective for preventing or delaying kidney disease in type 1 diabetes DCCT/EDIC
Neurologic Outcomes Confirmed Clinical Neuropathy (CCN) • Abnormal exam consistent with peripheral sensory neuropathy and • Abnormal nerve conduction in at least 2 peripheral nerves (or abnormal autonomic finding*) * Not used in EDIC definition DCCT/EDIC
Confirmed Clinical Neuropathy Prevalence • DCCT: 64% RRR with INT • EDIC 13/14: incr prevalence INT + Conv30% • RR with prior INT, NS after adjustment for age/ht/close out NC • NB time b/w measurements 13-20 yrs * Percent * * p < 0.001 DCCT/EDIC
Reduction of Incidence of Confirmed Clinical Neuropathy with Intensive Therapy Mean A1c was associated with increased risk in both DCCT and EDIC DCCT/EDIC
Neurologic Outcomes Cardiac Autonomic Neuropathy Abnormal Autonomic Response R-R Variation < 15 OR R-R Variation < 20 AND Valsalva ratio < 1.5 OR Orthostatic hypotension DCCT/EDIC
Cardiac Autonomic Neuropathy Prevalence INT CONV Percent *p < 0.01 **p < 0.05 DCCT/EDIC