Download
1 / 4
40 likes | 135 Views
10B. Schools Percent of students with disabilities being served in the general education setting 80% or more each day. (Three year trend, compared with 2002 State Average). State Average ‘02 -- 38.1%. Regular Classroom Variable (REG CLASS % )

E N D
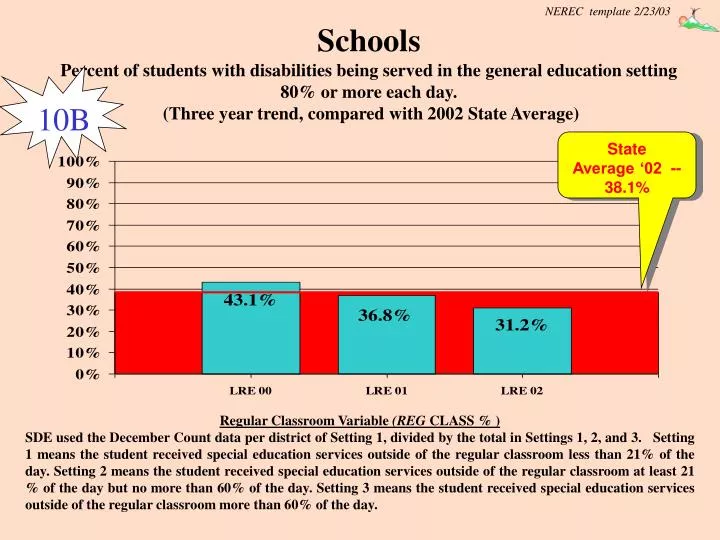
10B SchoolsPercent of students with disabilities being served in the general education setting 80% or more each day. (Three year trend, compared with 2002 State Average) StateAverage ‘02 -- 38.1% Regular Classroom Variable (REG CLASS % ) SDE used the December Count data per district of Setting 1, divided by the total in Settings 1, 2, and 3. Setting 1 means the student received special education services outside of the regular classroom less than 21% of the day. Setting 2 means the student received special education services outside of the regular classroom at least 21 % of the day but no more than 60% of the day. Setting 3 means the student received special education services outside of the regular classroom more than 60% of the day.
11B SchoolsPercent of students with disabilities scoring at or above the 40th %ile in the reading composite score of the CTBS (Three year trend, compared with 2002 State Average) ‘02 StateAverage 22.7% Test Score Variable (% At/Above) SDE used the statewide achievement test scores of students grades 3-9 Standardized and Accommodated Reading Composite at or above 40%ile, divided by the # of Special education students who took the test with or without accommodations, showing a three year trend: 2000, 2001, 2002.
SchoolsPercent of Students Identified as Learning Disabled (Three year trend, compared with 2002 State Average) ‘02 StateAverage 8.5% Learning Disabilities Variable LD % SDE used the December 1 count of students with ages 6-21 who were eligible for federal funding as "learning disabled" for each year divided by total membership. For total membership of the district , SDE used the average of the 40th, 80th and 120th day membership counts for districts from for years 00-01, 01-02, and used the 40th day enrollment for ‘03. Total membership is a headcount of state-funded students, with three and four-year old students and kindergarteners counted as 0.5 unless the kindergarteners are in a funded full-day program.
SchoolsPercent of Students with Disabilities Participating in the Spring Test Admin (Three year trend, compared with 2002 State Average) ‘02 StateAverage 79.8% Test Participation Variable (% in Spring Testing) SDE used the number of students with disabilities who marked the Special Education bubble divided by the number of students with disabilities on the 120th day in grades 3 - 9 for 99-00. SDE used the number of students with disabilities who marked the Special Education bubble plus the number of students who took the alternate assessment, divided by the number of students with disabilities on the 120th day in grades 3 - 9 for 00-01 and 01-02. Percentages over 100 may be due to the following: (1) gifted bubbling in Sp Ed (2) students identified for Sp Ed after 120th day but before tests were given, or (3) Non Sp Ed students bubbling in Sp Ed bubble.