Download
1 / 26
260 likes | 266 Views
Predicting Availability What is Link Availability?. Link availability is the percentage of time over a year that the an FSO link will be operational. 5 Nines = 99.999% = Down 5 min / year 4 Nines = 99.99% = Down 53 min / year 3 Nines = 99.9% = Down 8.75 hrs / year

E N D
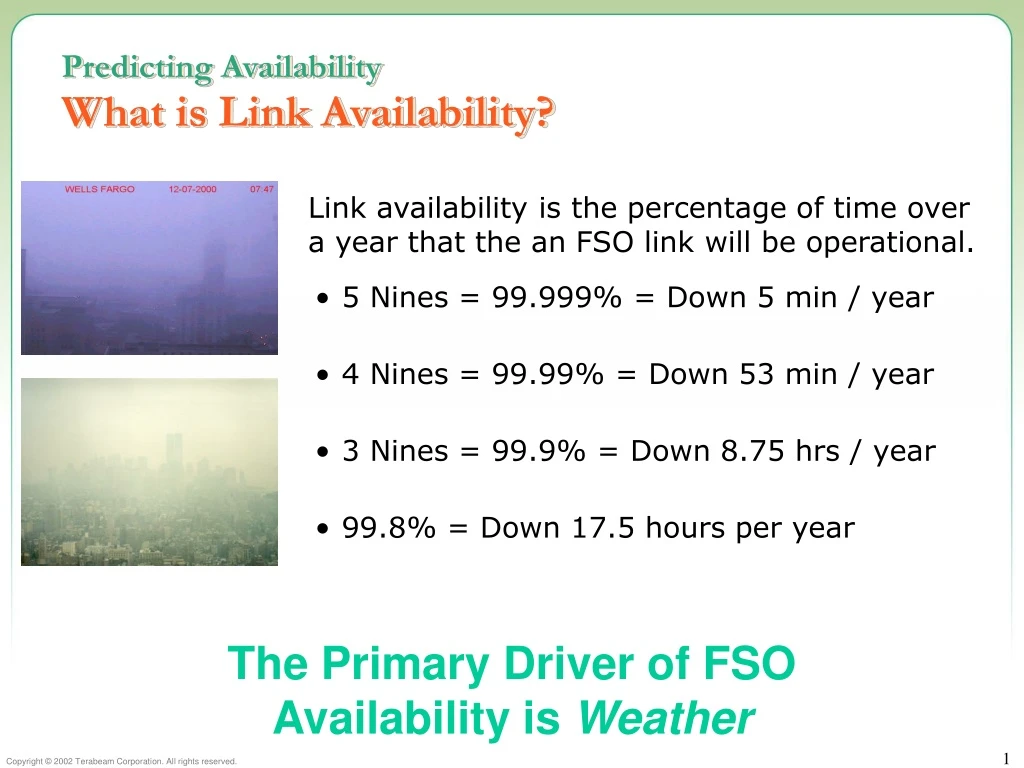
Predicting AvailabilityWhat is Link Availability? Link availability is the percentage of time over a year that the an FSO link will be operational. • 5 Nines = 99.999% = Down 5 min / year • 4 Nines = 99.99% = Down 53 min / year • 3 Nines = 99.9% = Down 8.75 hrs / year • 99.8% = Down 17.5 hours per year The Primary Driver of FSO Availability is Weather
Predicting AvailabilityPart 1: Clear Air Link Margin • Difference between the optical power received in clear air versus the minimum power level required for a given error rate. • Expressed in terms of “dB” • 30dB of margin = 1 part in 1,000 required • 50dB of margin = 1 part in 100,000 required • Typical error rate 1e-9 (1 in a billion) • 1e-12 reduces margin by approximately 1 dB • 1e-6 increases margin by approximately 1 dB
Predicting AvailabilityPart 2: Weather Attenuation • Curves based upon surface visibility • Seattle 99.99 attenuation = >212 dB/km • Seattle 99.9 attenuation = 98 dB/km • Denver 99.9 attenuation = 40 dB/km • Phoenix 99.9 attenuation = <5 dB/km
Predicting AvailabilityThe Hard Part – Atmospheric Attenuation Curve The Inputs • Visibility information from nearby airport weather stations • 100m visibility corresponds to 128 dB/km at 1550nm • 400m visibility corresponds to 27 dB/km at 1550nm • Cloud ceiling information • Geographic location of airport vs. installation location • Urban heat island effects The Output • A four dimensional atmospheric model • Latitude • Longitude • Altitude • Time Visibility Sensor
Predicting AvailabilityExamples of Visibility Visibility of 1 football field ~ 130 dB/km
Predicting AvailabilityAirport Surface Visibility Data • September • Best – 3600m • Average – 400m • Worst – 200m • Visibility measured at 550nm
Predicting AvailabilityCloud Ceiling Impact Stockholm, Sweden, 1982-97
Predicting AvailabilityAttenuation Vs. Percentage Time Occurrence Three Altitudes in Seattle • At 99.8 Availability • Surface = 60 dB/km • 30th fl = 85 dB/km • 52nd fl = 105 dB/km • A link capable of operating at 50 dB/km • Surface = 99.78% • 30th fl = 99.72% • 52nd fl = 99.58%
Predicting AvailabilityPutting It All Together – A LinkBudget • Installation Characteristics: • 1550nm Gigabit Ethernet link (1.25 Gbps) • Automatic pointing and tracking • 5 dB windows at each end • 400m range • 10m Altitude • Budget: • Transmit Power 1000 mW 30 dB • Receive Sensitivity (-36 dBm) 36 dB • Geometric Loss w/o fog at 0.4 km -2.0 dB • Window attenuation (2 x 5.0 dB) -10.0 dB • Mispoint Loss -1.0 dB • Total Optical System Losses -9.0 dB • Total Remainder for Weather 44.0 dB • Therefore, the maximum allowed weather attenuation is: • 44 dB/ 0.40 km = 110 dB/km
Predicting AvailabilityFinal Result: Link Weather Availability • Best Year • = 99.995 • Average Year • = 99.94 • Worst Year • = 99.66
Predicting Availability99.9% Attenuation Margins Attenuation margin (dB/km) required for 99.9% availability - City by City Notes: Data derived from surface visibility data (altitude effects not included) and Kruse formula Source: Terabeam Weather Group, Jan 2001
99.9 99.9 99.8 99.7 99.8 99.7 Predicting AvailabilityVariability w/ Location: Washington, DC Washington National Relative link footprints Dulles
6000m 4000m 2000m 0m New York Dallas Miami Seattle Denver Phoenix Predicting AvailabilityReal World 99.9% FSO Ranges
Cornea Retina Eye SafetyThe Eye’s Response to Laser Light • Cornea • Wavelengths above 1400 nm almost completely absorbed by the cornea and not transmitted to the retina • Retina • Wavelengths below 1400 nm (close to visible light) focused onto the retina, so power levels must be lower to ensure safety • Maximum Permissible Exposure (MPE) limits established by ANSI
Viewing Condition Class One Eye-Safe (all conditions) aided I 1 1 Eye-Safe w/o Optical Aids unaided -- 1 1 M Class Two (Visible only 400 to 700 nm) < 0.25 sec (eye aversion) aided II 2 2 < 0.25 sec unaided -- 2 2 M Class Three “a” or “R” Minor Hazard aided IIIa (visible only) 3a 3 R (5 times Class 1) unaided -- 3a -- any IIIb 3 b 3 B Class Three “b” - Eye Hazard Class Four Eye Hazard any IV 4 4 Eye SafetyLaser Safety Standards • Most FSO systems are Class 1 or 1M
Eye SafetyStandards and FSO Use • Class 1 systems can be installed in Unrestricted locations • Class 1M systems can be installed in Restricted areas • Class 3B and above only in Controlled locations
Applications & Network Integration Emerging FSO Uses • “Sprinkler head” extensions of fiber • Closure of SONET/SDH metro rings • Spatial diversity • Emergency communications • Data outsourcing/mirroring/SANS • Wireless backhaul
2 3 1 5 6 4 5 Applications & Network IntegrationDeployments Single customer access 1 Point-to-point connection 2 Campus connection 3 4 Diverse lateral 5 Backhaul or ring closure 6 Multi-tenant building • and more… • Mobile network extensions • Mobile network backhaul • Spatial diversity
Hudson River Jersey City Manhattan Merrill Lynch Office 2.6 km 1.8 km Merrill Lynch Office Merrill Lynch Office 1.6 km Applications & Network IntegrationDisaster Recovery – After 9/11 • Merrill Lynch urgently needed additional connectivity to three locations. • Terabeam installed Gig-E FSO units to build a ring topology to back up the SONET network • Installation was completed within 7 days of first call
Applications & Network IntegrationHybrid Solutions RF FSO Copper or Fiber Automatic protection switching between FSO, Millimeter Wave, and/or terrestrial fiber can approach 99.999% availability
FSO (30-400 THz) Applications & Network IntegrationHybrid Solutions: Non-Correlated Failures MMW (60 GHz)
Applications & Network IntegrationFree-Space & 60 GHz MMW Hybrids
The Future of FSOFSO Today • The high bandwidth of fiber with the speed and ease of installation of wireless • Unlicensed all over the world due to its inherent resistance to interference • Highly secure and safe • Allows through the window connectivity and single customer service • Fundamentally compliments fiber by accelerating the first and last mile
The Future of FSOWhat’s on the Horizon? • All optical – “Fiber through the air” • Lighter, smaller units • “Innocuous” form factors (e.g., a pane of glass acting as a receive element) • Fundamentally the cheapest way to cross the street at 100 Mbps • Can be used to provision big bandwidth almost everywhere • Where fiber can’t offer an adequate ROI • Where 99.9 is acceptable • To the home?