Download
1 / 5
50 likes | 143 Views
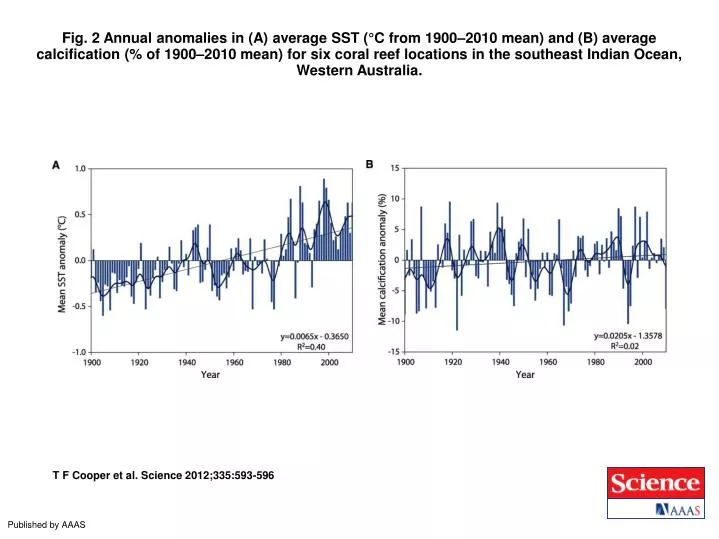
Fig. 2 Annual anomalies in (A) average SST (°C from 1900–2010 mean) and (B) average calcification (% of 1900–2010 mean) for six coral reef locations in the southeast Indian Ocean, Western Australia. T F Cooper et al. Science 2012;335:593-596. Published by AAAS.

E N D
Fig. 2 Annual anomalies in (A) average SST (°C from 1900–2010 mean) and (B) average calcification (% of 1900–2010 mean) for six coral reef locations in the southeast Indian Ocean, Western Australia. T F Cooper et al. Science 2012;335:593-596 Published by AAAS
Fig. 3 Relationships between decadal SST and calcification (cal) anomalies (anom.) for (A) Clerke Reef (change in cal anom. is 7.5%; range of SST anom., –0.20 to 0.27; n = 5 cores), (B) Imperieuse Reef (cal anom., 2.4%; SST anom., –0.20 to 0.28; n = 4), (C) Bundegi (cal anom., –8.6%; SST anom., –0.39 to 0.38; n = 4), (D) Tantabiddi (cal anom., 4.9%; SST anom., –0.29 to 0.36; n = 7), (E) Coral Bay (cal anom., 8.7%; SST anom., –0.40 to 0.46; n = 4), and (F) Houtman Abrolhos Islands (cal anom., 23.5%; SST anom., –3.8 to 0.55; n = 3). T F Cooper et al. Science 2012;335:593-596 Published by AAAS
Fig. 4 Average annual calcification anomalies, 1900–2010, for (A) Clerke Reef, (B) Imperieuse Reef, (C) Bundegi, (D) Tantabiddi, (E) Coral Bay, and (F) Houtman Abrolhos Islands. T F Cooper et al. Science 2012;335:593-596 Published by AAAS
Fig. 2. Record of Flinders Reef coral δ11B, reconstructed oceanic pH, aragonite saturation state, PDO and IPO indices, and coral calcification parameters. C Pelejero et al. Science 2005;309:2204-2207 Published by AAAS
Fig. 1. Distribution of present-day surface-ocean pH, location of the Flinders Reef coral site, and record of coral δ13C since 1708 A.D. (Top) Map showing present-day mean annual surface pH (24). C Pelejero et al. Science 2005;309:2204-2207 Published by AAAS