Download
1 / 42
420 likes | 425 Views
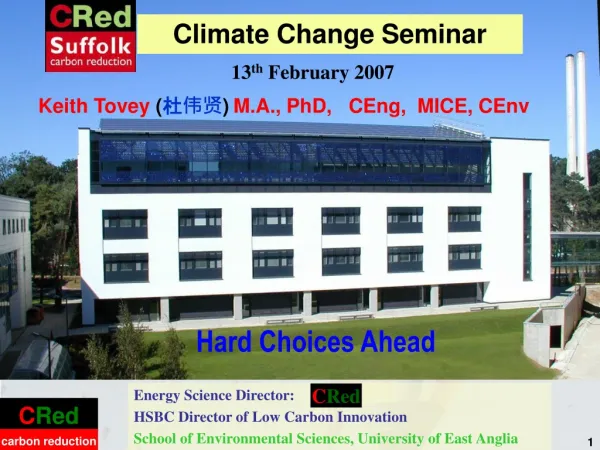
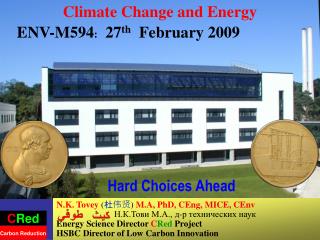
Route to a Low Carbon Future? A Stern Warning. Hard Choices Ahead. 19 th March 2007. Keith Tovey ( 杜伟贤 ) M.A., PhD, CEng, MICE, CEnv. C Red. Energy Science Director: HSBC Director of Low Carbon Innovation School of Environmental Sciences, University of East Anglia. 1.0

E N D
Route to a Low Carbon Future? A Stern Warning Hard Choices Ahead 19th March 2007 Keith Tovey (杜伟贤)M.A., PhD, CEng, MICE, CEnv CRed Energy Science Director: HSBC Director of Low Carbon Innovation School of Environmental Sciences, University of East Anglia
1.0 0.5 0.0 -0.5 1.0 0.5 0.0 -0.5 1.0 0.5 0.0 -0.5 Is Global Warming man made? actual predicted Temperature Rise (oC) 1860 1880 1900 1920 1940 1960 1980 2000 actual predicted Temperature Rise (oC) 1860 1880 1900 1920 1940 1960 1980 2000 actual predicted Temperature Rise (oC) 1860 1880 1900 1920 1940 1960 1980 2000 Prediction: Natural only good match until 1960 Prediction: Anthropogenic only Not a good match between 1920 and 1970 • Predictions include: • Greenhouse Gas emissions • Sulphates and ozone • Solar and volcanic activity Prediction: Natural and Anthropogenic Generally a good match Source: Hadley Centre, The Met.Office
Increasing Occurrence of Flood Increasing Occurrence of Drought Change in precipitation 1961-2001 Source: Tim Osborne, CRU Total summer precipitation Total winter precipitation
Norwich Consequence of ~ 1m rise Consequence of ~ 6m rise (Source: Prof. Bill McGuire, University College London) Norwich City would be playing water polo!
Climate ChangeArctic meltdown 1979 - 2003 2003 1979 • Summer ice coverage of Arctic Polar Region • Nasa satellite imagery • 20% reduction in 24 years Source: Nasa http://www.nasa.gov/centers/goddard/news/topstory/2003/1023esuice.html
Options for Electricity Generation in 2020 - Non-Renewable Methods Nuclear New Build assumes one new station is completed each year after 2017.
Options for Electricity Generation in 2020 - Renewable Area required to supply 5% of UK electricity needs ~ 300 sq km But energy needed to make PV takes up to 8 years to pay back in UK.
Options for Electricity Generation in 2020 - Renewable • Transport Fuels: • Biodiesel? • Bioethanol? • Compressed gas from • methane from waste. But Land Area required is very large - the area of Norfolk and Suffolk would be needed to generated just over 5% of UK electricity needs.
Solar Energy - The BroadSol Project Solar Collectors installed 27th January 2004 Annual Solar Gain 910 kWh
Our Choices: They are difficult: Energy Security There is a looming capacity shortfall Even with a full deployment of renewables. A 10-15% reduction in demand per house will see a rise of 7% in total demand • Opted Out Coal: Stations can only run for 20 000 hours more and must close by 2015 • New Nuclear assumes completing 1 new nuclear station each year beyond 2016 • New Coal assumes completing 1 new coal station each year beyond 2016
Our Choices: They are difficult • Do we want to exploit available renewables i.e onshore/offshore wind and biomass. Photovoltaics, tidal, wave are not options for next 20 years. • If our answer is NO • Do we want to see a renewal of nuclear power • Are we happy with this and the other attendant risks? • If our answer is NO • Do we want to return to using coal? • then carbon dioxide emissions will rise significantly • unless we can develop carbon sequestration and apply it to ALL our • COAL fired power stations within 10 years - unlikely. If our answer to coal is NO Do we want to leave things are they are and see continued exploitation of gas for both heating and electricity generation? >>>>>>
Our Choices: They are difficult • If our answer is YES • By 2020 • we will be dependent on around 70% of our heating and electricity from GAS • imported from countries like Russia, Iran, Iraq, Libya, Algeria • Are we happy with this prospect? >>>>>> • If not: • We need even more substantial cuts in energy use. • Or are we prepared to sacrifice our future to effects of Global Warming by using coal? - the North Norfolk Coal Field? – • Aylsham Colliery, North Walsham Pit? Do we wish to reconsider our stance on renewables? Inaction or delays in decision making will lead us down the GAS option route and all the attendantSecurity issues that raises.
Some Myths about Wind Energy • What happens when the wind does not blow?. • Large Coal /Nuclear Stations trip/ have failures and these cause a loss of power within a matter of minutes. • In terms of short term variations wind is more reliable. • Wind Turbines kill birds. • Evidence suggesta that a few birds are killed typically 3 per installed MW per year except in a few locations. In many cases it is much less • Oldest wind farm in UK on Burgar Hill has an RSPB reserve right next to it. • Currently UK has around 1700 MW wind turbines installed perhaps 5000 birds killed a year • Estimates of 1 million killed each year by vehicles
Historic and Future Demand for Electricity Business as usual Energy Efficient Future ? Number of households will rise by 17.5% by 2025 and consumption per household must fall by this amount just to remain static
Electricity Options for the Future • Energy Efficiency – consumption capped at 420 TWh by 2010 • But 68% growth in gas demand • (compared to 2002) • Business as Usual • 257% increase in gas consumption • ( compared to 2002) The Gas Scenario Assumes all new non-renewable generation is from gas. Replacements for ageing plant Additions to deal with demand changes Assumes 10.4% renewables by 2010 25% renewables by 2025
Alternative Electricity Options for the Future • 25% Renewables by 2025 • 20000 MW Wind • 16000 MW Other Renewables inc. Tidal, hydro, biomass etc. Energy Efficiency Scenario Other Options Some New Nuclear needed by 2025 if CO2 levels are to fall significantly and excessive gas demand is to be avoided Business as Usual Scenario New Nuclear is required even to reduce back to 1990 levels
On average each person in UK causes the emission of 9 tonnes of CO2 each year. How many people know what 9 tonnes of CO2 looks like? 5 hot air balloons per person per year. Around 4 million in Norfolk. In the developing world, the average is under 1 balloon per person Is this Fair? "Nobody made a greater mistake than he who did nothing because he thought he could do only a little." Edmund Burke (1727 – 1797)
Raising Awareness At Gao’an No 1 Primary School in Xuhui District, Shanghai • A tumble dryer uses 4 times as much energy as a washing machine. Using it 5 times a week will cost over £100 a year just for this appliance alone and emit over half a tonne of CO2. • 10 gms of carbon dioxide has an equivalent volume of 1 party balloon. • A Mobile Phone charger: up to 20 kWh per year • ~ 1000 balloons each year. 10 kg CO2 • Standby on electrical appliances • 60+ kWh a year - 4000 balloons. • Filling up with petrol (~£38 for a full tank – 40 litres) • --------- 90 kg of CO2 (5% of one hot air balloon) How far does one have to drive in a small family car (e.g. 1400 cc Toyota Corolla) to emit as much carbon dioxide as heating an old persons room for1 hour? 1.6 miles
Saving Energy – A Practical Guide Ways to Reduce Your Carbon Footprint Micro CHP Heat Pumps Micro Wind
Transport • Car: 5 door Toyota Yaris • Real performance is best at ~ 50 mph. Saves up to 15% in fuel consumption cf 70 mph. • Driver behaviour trials at Banham Poultry • Driver behaviour affects performance • Driver 2 uses 13.8% more fuel
Historic Trends: Freight Transport on Roads • Distance each tonne has travelled has increased by: • 223% since 1960 • 20% since 1990 • Is this increase in movement of freight conducive to optimum economic growth, energy security, and carbon reduction?
Involve the local Community • The residents on the island of Burray (Orkney) campaigned for a wind turbine. • On average they are more than self-sufficient in electricity needs and indeed are a net exporter of electricity. • Many of the Islanders bought shares in the project and are now reaping the reward. • Orkney is hoping to be a zero net emitter of carbon dioxide by 2015.
Electricity Statistics: • Each house in Norwich consumes, 3727 kWh per year. • Broadland 5057 kWh Breckland 5612 kWh • North Norfolk 5668 kWh South Norfolk 5797 kWh • Kings Lynn and 5908 kWh Great 5144 kWh • West Norfolk Yarmouth • A wind farm the size of Scroby Sands can supply twice domestic demand of Norwich or 66% on average. • (or 22% of total demand) • Saves ~ 70 000 to 75 000 tonnes of carbon dioxide a year or 40 000 hot air balloons each year. • The alternatives: • Persuade 30 000 motorists never to drive the car again • Or300 000 motorists to drive 1000 miles less each year. • Widespread deployment of small scale renewables, and energy conservation.
Hard Choices • What can we as individuals do? • What can we do collectively as a Community? • Visit the CRed WEB Site • Sign a pledge to • combat global warming • help secure a sustainable environment for our children • help reduce the adverse impacts of Global Warming • help secure energy supplies for the future • saving energy • Adopting technical solutions • Promoting Awareness • Promoting appropriate renewable energy www.cred-uk.org
Target Day Results of the “Big Switch-Off” With a concerted effort savings of 25% or more are possible How can these be translated into long term savings?
ZICER Building • Top floor is an exhibition area – also to promote PV • Windows are semi transparent • Mono-crystalline PV on roof ~ 27 kW in 10 arrays • Poly- crystalline on façade ~ 6/7 kW in 3 arrays Photo shows only part of top Floor
Arrangement of Cells on Facade Individual cells are connected horizontally If individual cells are connected vertically, only those cells actually in shadow are affected. As shadow covers one column all cells are inactive
Use of PV generated energy Peak output is 34 kW Sometimes electricity is exported Inverters are only 91% efficient Most use is for computers DC power packs are inefficient typically less than 60% efficient Need an integrated approach
Operation of the Main Building Regenerative heat exchanger Incoming air into the AHU Filter Heater The air passes through hollow cores in the ceiling slabs The return air passes through the heat exchanger Out of the building • Mechanically ventilated that utilizes hollow core ceiling slabs as supply air ducts to the space Return stale air is extracted from each floor Air enters the internal occupied space
350 Good Management has reduced Energy Requirements The space heating consumption has reduced by 57%
3% Radiation Losses 11% Flue Losses GAS Exhaust Heat Exchanger Engine Generator 36% Electricity 50% Heat Conversion efficiency improvements – Building Scale CHP Localised generation makes use of waste heat. Reduces conversion losses significantly 36%efficient 61% Flue Losses 86%efficient Engine heat Exchanger
Conversion efficiency improvements Before installation After installation This represents a 33% saving in carbon dioxide
Conversion efficiency improvements Load Factor of CHP Plant at UEA Demand for Heat is low in summer: plant cannot be used effectively More electricity could be generated in summer
Heat from external source Desorber Compressor Heat Exchanger W ~ 0 High Temperature High Pressure Heat rejected Absorber Condenser Throttle Valve Evaporator Low Temperature Low Pressure Heat extracted for cooling Conversion efficiency improvements Normal Chilling Adsorption Chilling 19
A 1 MW Adsorption chiller 1 MW 吸附冷却器 • Adsorption Heat pump uses Waste Heat from CHP • Will provide most of chilling requirements in summer • Will reduce electricity demand in summer • Will increase electricity generated locally • Save 500 – 700 tonnes Carbon Dioxide annually
Conclusions • Global Warming will affect us all - in next few decades • Energy Security will become increasingly important. Inaction over making difficult decisions now will make Energy Insecurity more likely in future. • Move towards energy conservation and LOCAL generation of energy and small changes to behaviour. It is as much about the individual’s response to use of energy as any technical measures the Government may take. Awareness Raising is important • Sensible integrated design of buildings, incorporating innovative use of renewable energy, adaptive management systems and addressing functional energy uses are also important. Wind (and possibly biomass) are the only real alternatives for renewable generation in next 5 – 10 years. • Otherwise Nuclear??? • Even if we are not convinced about Global Warming – Energy Security issues will shortly start to affect us.
WEBSITE Cred-uk.org/ This presentation will be available from tomorrow at above WEB Site: follow Academic Links Conclusions • Need to act now otherwise we might have to make choice of whether we drive 1.6 miles or heat an old person’s room Are you up to the Challenge?: Will you make a pledge? "If you do not change direction, you may end up where you are heading." LaoTzu (604-531 BC) Chinese Artist and Taoist philosopher
The average family car releases 10 grams of CO2 every 50m Animation Courtesy of Rob Hannington