Download
1 / 21
210 likes | 331 Views
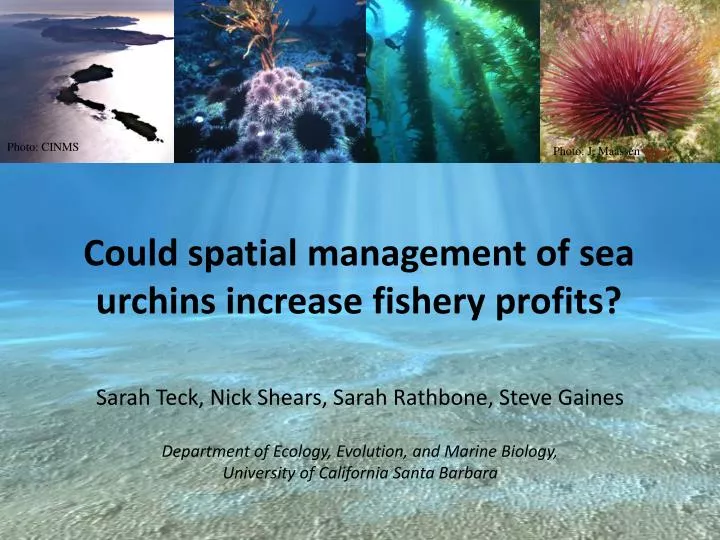
Photo: CINMS. Photo: J. Maassen. Could spatial management of sea urchins increase fishery profits?. Sarah Teck, Nick Shears, Sarah Rathbone, Steve Gaines Department of Ecology, Evolution, and Marine Biology, University of California Santa Barbara. Background. red sea urchin fishery:

E N D
Photo: CINMS Photo: J. Maassen Could spatial management of sea urchins increase fishery profits? Sarah Teck, Nick Shears, Sarah Rathbone, Steve Gaines Department of Ecology, Evolution, and Marine Biology, University of California Santa Barbara
Background • red sea urchin fishery: • California ~11.2 million lbs. ~$6.1 million • N. Channel Islands ~66% • Port of Santa Barbara ~52% • 90% western end Santa Barbara San Miguel Santa Cruz Santa Rosa Anacapa Image: www.incabrain.com
Background • seasonal variability in gonad quality influences price • ($0.39/lb vs >$1.00/lb) • fishermen race to harvest year-round vs. waiting for optimal quality • (how much more $ would they make, if they waited?) • delaying harvest through spatial property rights, • TURF’s (Territorial Use Rights in Fisheries) • fishermen’s profits • (also would save time, no need to survey area to fish during suboptimal conditions, just wait for optimal quality)
Background • with fished species need to wait for • individuals and population growth • with urchins also need to wait for • seasonal gonad quality • first, we need to understand more detailed ecological information on temporal and spatial variability of gonad quality
Background • with fished species need to wait for individuals and population growth • with urchins also need to wait for • seasonal gonad quality • first, we need to understand more detailed ecological information on temporal and spatial variability of gonad quality
Channel Island field sampling Santa Barbara San Miguel Santa Cruz Santa Rosa Anacapa
Red urchin gonad variability over space gonad: somatic index (GSI) Santa Barbara San Miguel Santa Cruz Santa Rosa Anacapa
Red urchin gonad variability over time gonad: somatic index (GSI) Oct ‘08 Dec Feb ‘09 Mar May Jul Aug Oct
Red urchin gonad variability over time gonad: somatic index (GSI) Oct ‘08 Dec Feb ‘09 Mar May Jul Aug Oct
Red urchin gonad variability over time gonad: somatic index (GSI) Oct ‘08 Dec Feb ‘09 Mar May Jul Aug Oct
Red urchin gonad variability over time gonad: somatic index (GSI) Oct ‘08 Dec Feb ‘09 Mar May Jul Aug Oct
Red urchin gonad variability over time gonad: somatic index (GSI) Oct ‘08 Dec Feb ‘09 Mar May Jul Aug Oct
Red urchin landings 1985-2005 Purple urchin abundance 2007
purple sea urchin • purples compete with reds for kelp • not commercially harvested (smaller) • form persistent urchin barrens (mostly in the east) • long-term monitoring sites deforested by purples ~33% of the time—mostly in the east
manipulate ecology of a managed area to increase profits • kelp restoration
Long-term (1985-2007) Variation in Kelp and Urchin kelp Density (m-2) purple urchins Density (m-2) red urchins Biomass (gm-2) NPS—KFM data (eastern SCI and Anacapa Island)
Long-term (1985-2007) Variation in Kelp and Urchin kelp Density (m-2) purple urchins Density (m-2) red urchins Biomass (gm-2) NPS—KFM data (eastern SCI and Anacapa Island)
Long-term (1985-2007) Variation in Kelp and Urchin kelp Density (m-2) • Red urchins have persistently higher biomass inside of the reserves. • Reproductive output is ~4 times higher in kelp forests versus urchin barrens purple urchins Density (m-2) red urchins Biomass (gm-2) NPS—KFM data (eastern SCI and Anacapa Island)