Download
1 / 29
290 likes | 309 Views
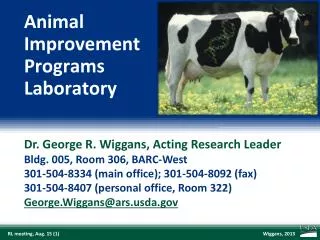
Heterosis and Breed Differences for Yield and Somatic Cell Scores of US Dairy Cattle in the 1990’s. PAUL VANRADEN Animal Improvement Programs Laboratory Agricultural Research Service, USDA, Beltsville, MD paul@aipl.arsusda.gov. Holstein Guernsey. USDA Yearbook of Agriculture 1947.

E N D
Heterosis and Breed Differences for Yield and Somatic Cell Scores of US Dairy Cattle in the 1990’s. PAUL VANRADEN Animal Improvement Programs Laboratory Agricultural Research Service, USDA, Beltsville, MD paul@aipl.arsusda.gov
Holstein Guernsey USDA Yearbook of Agriculture 1947 From 1939-1954, M.H. Fohrman studied 113 Guernsey, Jersey, Holstein, and Red Danes crosses at Beltsville. Another study of 137 Ayrshire, Brown Swiss and Holstein crosses was conducted from 1959-1968 (McDowell and McDaniel, 1968).
Red Dane Jersey USDA Yearbook of Agriculture 1947 Crossbreds averaged 12,904 pounds of milk and 588 pounds of butterfat, outperforming dams by more than sire proof predictions (Fohrman,1947). In 1945, advanced register Holsteins averaged 13,833 pounds of milk and 493 pounds of fat.
Breeds Are Evaluated Separately • Separate data sets reduce bias in evaluations within breeds, but provide: • No evaluations for crossbreds • No method to compare cows across breeds • New Zealand, Australia, and the Netherlands include crossbreds and account for heterosis in evaluations. • USDA-DHIA evaluations exclude crossbred cows unless identified as part of a “grading-up” program.
Objectives • Document the number and type of crossbred cows in the US. • Estimate heterosis and breed differences using cows of different breed composition competing in the same herd. • Compare the economic merit of crossbred and purebred cows.
Traits Considered • Milk, fat, and protein yields • Somatic cell score (SCS) • Productive life (PL) • Linear type composites not available • Body size estimates obtained from literature • Udder and leg trait estimates assumed zero • Net merit, cheese merit, fluid merit calculated • Adjusted to Holstein scale • Fertility, mortality, and calving ease not available
Yield Traits & SCS Data • Data were from the national test-day database available May, 2001. • 572 herds each with at least 5 crossbred cows • 10,442crossbred cows born since 1990 • 140,421 purebred herdmates (80% were Holstein) • Crossbreds defined by sire breed and maternal grandparent breeds. • Sires were purebred, dam breed used for unknown maternal grandparent breed • XX (crossbred) not accepted for maternal grandparents • Holstein and Red & White considered one breed
Yield Traits & SCS Edits • 85% of tests included fat, 82% protein, and 73% SCS • Edits applied: • Lactation length at least 250 days • At least 5 milk tests required before day 305 • Sire PTA was obtained to account for possible differences in selection intensity of purebreds vs. crossbreds.
Yield Traits & SCS Models • The models included effects of: • Herd-year-season • Age • Stage of lactation • Regression on sire PTA • Interaction of sire breed and maternal grand-parent breeds • Individual 3-breed interactions were weighted by number of observations to obtain: • Specific and general heterosis • General recombination effect
Number of F1 & Purebred CowsIn Mixed Breed Contemporary Groups
Number of F1 & Backcross Cows With Holstein Sire or Grandparent
Productive Life Data • Data from the national database available July, 1994 • 41,131 crossbred cows born from 1960 through 1991 • 726,344 purebred cows in the same herd-years • Breed composition from five generation pedigrees • Percent genes from each breed • Progeny breed = mean of parents’ breeds • Unknown parent breed = progeny breed • Breed ‘XX’ progeny with unknown parents excluded • Holstein and Red & White considered one breed
Productive Life Models • Model 1 included effects of: • Herd-year-season • Regressions on breed composition • Regression on coefficient of heterosis • Incomplete records weighted by age • Model 2 also included: • Interaction of birth year with breed composition • Interaction of birth year with heterosis
Results • Estimated breed means • Estimates of heterosis • Economic comparisons • Rank other breeds on Holstein base • Some new crossbreeding theory
Breed Effects for Yield TraitsCalculated from Holstein Means
Holstein Jersey USDA Yearbook of Agriculture 1947 All cows sired by Beltsville Holstein No. 966
Jersey Holstein USDA Yearbook of Agriculture 1947 X-1 and X-47 were sired by an unidentified Jersey sire. All others sired by Beltsville Jersey No. 1114
Merit of F1 Holstein Crossbreds Compared to 2000 genetic base for Holstein
Crossbreeding TheoryHolstein Brown Swiss Protein Yield 0.96 0.94 0.92 Protein kg/d — Holstein mean — Additive (A) only 0.90 —A+Dominance (D) max heterosis (H) 0.88 — A+D min H — A+D+AA max H 0.86 — A+D+AA min H 0 25 50 75 100 % Holstein genes
Heterosis and Inbreeding • Animals become more related within but not across breeds. • Inbreeding rises by 2 to 3% per decade. • Crossbreeding removes accumulated inbreeding depression. • Heterosis for yield should increase by 0.6 to 0.9% per decade.
Conclusions • Currently< 0.5% of DHI cows are crossbred. • Heterosis was about 4% for yield traits, < 1% (unfavorable) for SCS, and 1% for PL. • Profit from Jersey Holstein and Brown Swiss Holstein crosses is higher than from Holsteins. • Fewer extreme bulls are found in minor breeds. • Backcross yields were higher than expected.
Three-Breed Crosses USDA Yearbook of Agriculture 1947 Butterfat yield of three breed crosses was greater than from their F1 crossbred dams. Three breed crosses averaged 14,927 pounds of milk and 641 pounds of butterfat as 2-year-olds in 1947.