Download
1 / 35
370 likes | 669 Views
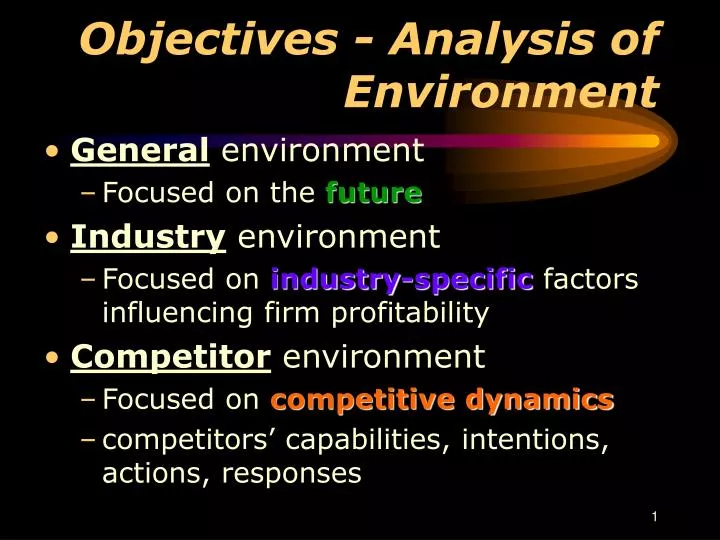
Objectives - Analysis of Environment. General environment Focused on the future Industry environment Focused on industry-specific factors influencing firm profitability Competitor environment Focused on competitive dynamics competitors’ capabilities, intentions, actions, responses.

E N D
Objectives - Analysis of Environment • General environment • Focused on the future • Industry environment • Focused on industry-specific factors influencing firm profitability • Competitor environment • Focused on competitive dynamics • competitors’ capabilities, intentions, actions, responses
Analysis of Environment Scan: Identify signals of changes and trends Monitor: interpret changes & trends Forecast: future scenarios from monitoring Assess: timing and importance of forecast to current or prospective firm strategies Which PEOPLE in the firm should do this? What limits the effectiveness of this process? Is a continuous process
Analysis of Environment • Your firm is interdependent with BROAD institutional dynamics: • Demographic • Economic • Political/legal • Sociocultural • Technological • Global
Analysis of Environment Demographic trends in … • Population size • Age structure • Skills/education • Geographic distribution • Ethnic mix • Income distribution
Analysis of Environment Economic segment (examples) • Inflation/interest rates (hurdle costs) • Trade deficits or surpluses • Budget deficits or surpluses • Consumption, savings, tax rates • GDP, business cycles
Political/Legal Segment (examples) Analysis of Environment • Antitrust laws (Whole Foods) • Tax laws (incentives) • Regulatory philosophies (SOX) • Labor/training laws (EEOC) • Educational policies (gov backed student loans)
Sociocultural segment (examples) Analysis of Environment • Opportunity cost of work (leisure) • Social concerns (greening, alcohol, meat) • Shifts in social preferences (on-line networking) • Shifts in product/service preferences (track my child; Care Trak Int’l)
Analysis of Environment Technological Segment (examples) • Process architectures (McD, FedEx) • New General Purpose Technologies (IT) • Private / Public R&D (Human Genome Project) • Converging technologies (VOIP, bioinformatics) • Standard setting (cell phone interoperability)
Global Environmental Analysis • Trade regions as boundaries • Critical global markets • Locating product & factor markets • cultural and institutional attributes • IP & property rights
Environmental Analysis Segment dynamics • Demographic • Economic • Political/legal • Sociocultural • Technological • Global • Generate economic effects on industries/firms (S/D, & factor costs)
Industry Environment • Interdependence among firms competing for similar customers • Competitive actions and responses. • Interactions among factors determine industry profit potential. 1. Threat of new entrants 2. Power of suppliers 3. Power of buyers 4. Product substitutes 5. Intensity of rivalry
Industry Environment • Define the industry - current and potential customers and the firms that serve them. • Analyze industry and competitors. • Note: • Suppliers and buyers can become competitors through integration. • Producers of potential substitutes may become competitors.
Threat of New Entrants Economies of scale Product differentiation Capital requirements Switching costs Access to distribution channels Cost disadvantages independent of scale (e.g., sites, subsidies, learning) Government policy Expected retaliation Barriers to entry
Learning effects • World War 2 - same plants, same rate of output - lower costs over time • Important for complex products and processes where humans can learn • A possible source of ‘first-mover’ advantage • Boston Consulting Group focused on the experience curve and learning effects
A B AC1 Learning C AC2 Economies ofScale Versus Learning Cost ($ per unit of output) Economies of Scale – reversible. Output
Bargaining Power of Suppliers • A supplier group is powerful when: it is dominated by a few large companies; satisfactory substitute products are not available to industry firms; industry firms are not a significant customer for the supplier group; suppliers’ goods are critical to buyers’ marketplace success; effectiveness of suppliers’ products has created high switching costs; suppliers are a credible threat to integrate forward into the buyers’ industry.
Bargaining Power of Buyers • Buyers (customers) are powerful when: • they purchase a large portion of an industry’s total output • the sales of the product being purchased account for a significant portion of the seller’s annual revenues • they could easily switch to another product • the industry’s products are undifferentiated or standardized, and buyers pose a credible threat if they were to integrate backward into the seller’s industry
Threat of Substitute Products • Product substitutes are strong threat when: • customers face few switching costs • substitute product’s price is lower • substitute product’s quality and performance capabilities are equal to or greater than those of the competing product
Intensity of Rivalry • Intensity of rivalry is stronger when competitors: • are numerous or equally balanced • experience slow industry growth • have high fixed costs or high storage costs • lack differentiation or have low switching costs • experience high strategic stakes • have high exit barriers
High Exit Barriers • Common exit barriers include: • specialized assets (assets with values linked to a particular business or location) • fixed costs of exit such as labor agreements • strategic interrelationships (relationships of mutual dependence between one business and other parts of a company’s operation, such as shared facilities and access to financial markets) • emotional barriers (career concerns, loyalty to employees, etc.) • government and social restrictions
Industry Scope • What is an industry? • Useful to consider chain of related products (complements) when assessing industry attractiveness
Orit Gadiesh and James L. Gilbert Harvard Business Review May-June 1998 40% The value chain for the PC industry includes six key activities; the profitability of the activities varies widely. Manufacturers compete in the largest but least-profitable segment of the chain. 30 20 10 0 100% 0 peripherals other components personal computers software microprocessors services share of industry revenue THE PC INDUSTRY’S PROFIT POOL • Value chain focus • Axes • Vertical—operating margin • Horizontal—share of industry
The Profit Pool Lens • The profit pool is the total profit earned in an industry at all points along the industry’s value chain • Segment profitability may vary by customer group, product category, geographic market, or distribution channel • Profit concentration may be very different than revenue concentration • Shape of the profit pool reflects the competitive dynamics of a business • Interactions of companies and customers • Competitive strategies of competitors • Product pools are not stagnant
THE U.S. AUTO INDUSTRY’S PROFIT POOL The automotive industry encompasses many value-chain activities. The way that profits and revenues are distributed among these activities varies greatly. The most profitable areas of the car business are not the ones that generate the biggest revenues. 25% 20 15 operating margin 10 5 0 auto loans gasoline 0 100% new car dealers auto insurance service repair leasing used car dealers warranty auto manufacturing share of industry revenue aftermarket parts auto rental source: Harvard Business Review, May-June 1998
Profit Pools: Company Examples Sources of Highest ROI Auto leasing, insurance Packing materials, storage Service Accessories (consumer products), leasing, service, restaurants Film Firms Automakers U-Haul Elevators (OTIS) Harley Davidson Polaroid Core Business Auto manufacturing Truck Rental Elevator Manufacturing Motorcycles Instant Photography Cameras
Implications • Focusing on growth and market share can lead a company to choose unprofitable segments of an industry • Today’s deep revenue pool may be tomorrow’s dry hole. • The goal should be to focus on profitable opportunities • Industry should be considered more broadly than traditional definition • Automobile industry includes • Component manufacture and supply • New car assembly and delivery • New car warrantee and service • New car financing, leasing, and insurance • Used car sales and service
Strategic Groups Strategic group: a group of firms in an industry following the same or similar strategy along the same strategic dimensions. The strategy followed by a strategic group differs from strategies being implemented by other companies in the industry.
Competitor behavior Competitor intelligence is the ethical gathering of needed information and data about competitors’ objectives, strategies, assumptions, and capabilities what drives the competitor as shown by its future objectives what the competitor is doing and can do as revealed by its current strategy What the competitor believes about itself and the industry, as shown by its assumptions What the the competitor may be able to do, as shown by its capabilities
Future objectives Current strategy Assumptions Response Capabilities Competitor Analysis Response: What will our competitors do in the future? Where do we hold an advantage over our competitors? How will this change our relationship with our competitors?
Assessing competitive Strength vis a vis Rivals 1. List industry key success factors and other relevant measures of competitive strength 2. Rate firm and key rivals on each factor using rating scale of 1 - 10 (1 = weak; 10 = strong) 3. Decide whether to use a weighted or unweighted rating system 4. Sum individual ratings to get overall measure of competitive strength for each rival 5. Determine whether the firm enjoys a competitive advantage or suffers from competitive disadvantage
An Unweighted Competitive Strength Assessment KSF/Strength Measure ABC Co. Rival 1 Rival 2 Rival 3 Rival 4 Quality/product performance 8 5 10 1 6 Reputation/image 8 7 10 1 6 Manufacturing capability 2 10 4 5 1 Technological skills 10 1 7 3 8 Dealer network/distribution 9 4 10 5 1 New product innovation 9 4 10 5 1 Financial resources 5 10 7 3 1 Relative cost position 5 10 3 1 4 Customer service capability 5 7 10 1 4 Overall strength rating 61 58 71 25 32 Rating Scale: 1 = Very weak; 10 = Very strong
Sum of weights 1.00 Overall strength rating 6.20 8.20 7.00 2.10 2.90 A Weighted Competitive Strength Assessment KSF/Strength Measure Weight ABC Co. Rival 1 Rival 2 Rival 3 Rival 4 Quality/product performance 0.10 8/0.80 5/0.50 10/1.00 1/0.10 6/0.60 Reputation/image 0.10 8/0.80 7/0.70 10/1.00 1/0.10 6/0.60 Manufacturing capability 0.10 2/0.20 10/1.00 4/0.40 5/0.50 1/0.10 Technological skills 0.05 10/0.50 1/0.05 7/0.35 3/0.15 8/0.40 Dealer network/distribution 0.05 9/0.45 4/0.20 10/0.50 5/0.25 1/0.05 New product innovation 0.05 9/0.45 4/0.20 10/0.50 5/0.25 1/0.05 Financial resources 0.10 5/0.50 10/1.00 7/0.70 3/0.30 1/0.10 Relative cost position 0.35 5/1.75 10/3.50 3/1.05 1/0.35 4/1.40 Customer service capability 0.15 5/0.75 7/1.05 10/1.50 1/0.15 4/1.60 Rating Scale: 1 = Very weak; 10 = Very strong
Why Do a Competitive Strength Assessment ? Reveals firm’s competitive position Pinpoints the company’s competitive strengths and weaknesses Identifies competitive advantage, parity, or disadvantage Identifies possible offensive attacks Identifies possible defensive actions