Download
1 / 20
200 likes | 345 Views
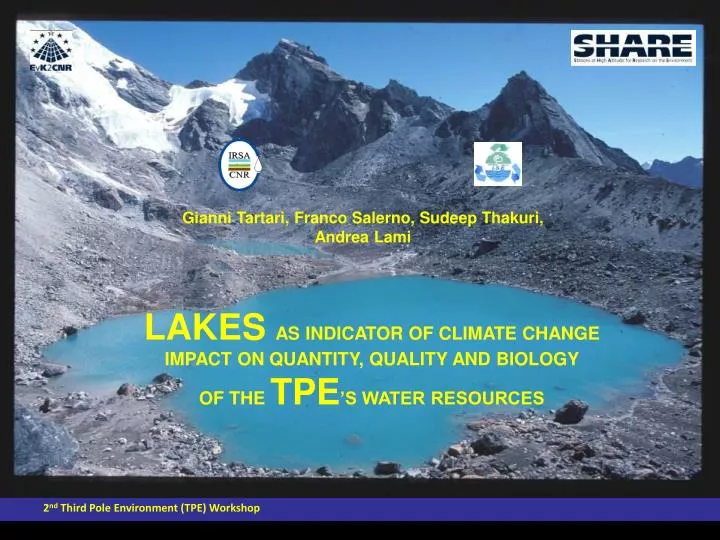
LAKES AS INDICATOR OF CLIMATE CHANGE IMPACT ON QUANTITY, QUALITY AND BIOLOGY OF THE TPE ’S WATER RESOURCES. Gianni Tartari, Franco Salerno, Sudeep Thakuri, Andrea Lami. Climate research gaps.

E N D
LAKESAS INDICATOR OF CLIMATE CHANGEIMPACT ON QUANTITY, QUALITY AND BIOLOGY OF THE TPE’S WATER RESOURCES Gianni Tartari, Franco Salerno, Sudeep Thakuri, Andrea Lami
Climate research gaps • The world has passed through a decade long Global warming stagnationperiod, but the debate has started whether the warming is permanently paused or is temporary which accelerate after some period (Kerr, 2009). • The complex spatiotemporal Variability of Asian Monsoon system only recently appear understood and is still difficult to predict the different patterns of climate change (Temperature and Precipitation) across the TPE (Cook et al, 2010) 1. What is known and unknown? Water research gaps • Lack of scientific data for analysing the Different Patterns of Climate Change Impacts on Water Resourcesacross the TPE is one of the major limitation. • Many of the current researches are focusing on some single components of the water cycle, but with really few Linkages among them (reality is complex: oversimplification, exaggeration, or ignoring serious matters can be consequential, Kargel et al. , 2010). • In many case the researches are confined to the Quantitative aspects of the change, forgetting completely the impacts on Quality and Biology of water bodies.
2. Global and North Hemisphere warming North Hemisphere warming is now 0.24 °C decade-1 since 1960, the double than the Global warming (0.13 °C decade-1). These studies show two phases of global warming (1910s- 1940s and 1960s- now) separated by a period of stagnant temperatures (Kerr, 2009). The warming from the 1910s to the 1940s is attributed to natural causes (Brönnimann, 2009). By contrast, the warming since the 1960s is attributed largely to anthropogenic influences . Therefore we argue since 1960s.
3. Glacier and Lakes changes across the region since 1960 Modified from Kargel et al. , 2010 • Precipitation lees influenced by monsoon • Glaciers grow by winter accumulation • Less glacier disintegration (advances) • Lakes growth • Less intense melting, more intense sublimation • Less debris cover • More sensitive to precipitation changes and wind • More intense melting • More debris cover • Glaciers are more sensitive to warming • Precipitation more dominated by monsoon • Glaciers grow by summer accumulation • More lake growth and glacier disintegration Glacier and lakes behavior varies across the region, with faster retreat in the east. Sensivity could be influenced by Elevated Heat Pump (EHP)
4. Our key questions • how is the spatial pattern of the climate change across the TPE range? • 2) how is this pattern impacting the water quantity, water quality and biology/ecology of glacial lakes.
The CCQQB Project 5. Aims of this presentation Focus the attention on lentic environments, considering their clear dependency with climate change and glacial retreats. To propose a methodological approach to use lakes as indicator of change across the spatial pattern of the TPE.
A methodological approach based on two decades of experience This activity started in the 1989 by IRSA-CNR in the framework of the projects carried out by the EvK2CNR Committee and in collaboration of NAST. Since 1994 the activity is developed jointly with ISE-CNR. More recently has been included in the context of the interdisciplinary activities promoted by SHARE. CCQQB is presented as core project on water resources in SHARE Program (Stations at High Altitude for Research on the Environment)
6. Our case study The Sagarmatha National Park (Mt Everest, Central Hymalaya, Nepal) Himalaya: Sector 4 The inventory of the Nepali Lakes reveales 2323 glacial lakes above 3,500m (Mool et al. 2001). Potentially dangerous glacial lakes in Nepal. (Mool et al. 2001)
7. Climate change drivers (temperature…) Correlation coefficient r = 0.70 Land based data 0.03 °C y-1 0.03 °C y-1 Calibration Tree ring Validation Model-based data i.e. HadCRU TS3 Temperature trend We observered a constant increasing rate of temperature from ‘60s to ‘90s and then, from ‘90s to ’04.
9. Climate change drivers (…precipitation) Precipitation trend: ‘60s to ‘90s- increasing trend of precipitation, and ‘90s to ’08 - decresing trend of precipitation.
10. Mapping and satellite imagery For this study in Sagarmatha National Park following maps and satellite images were used: 1960s: India Survey 1960s, scale 1:50,000 1990s: HMG/N official maps 1992, scale 1:50,000 2008: ALHOS 2008 digital satellite imagery
Nearly all (28 out of 29 in SNP) are ‘black glaciers’, known also as D-type or debris-covered glaciers; these are glaciers in which the ablation zone is almost entirely covered by surface debris that significantly reduce the energy exchanges between the ice and the atmosphere. 11a. Glaciers 2nd Third Pole Environment (TPE) Workshop
11b. Glaciers • SNP experienced a small net reduction in glacier cover of 19.6 km2(-4.9% in total, -0.15 % per year) from 403.9 km2 at the end of the ‘50s to 384.6 km2 at the start of the ‘90s. • From ‘90s to 2008, SNP experienced an higher net reduction in glacier cover of 28.4 km2(-7.0% in total, -0.44% per year) It should be stressed here that the higher reduction of the glacier might be because of delay response of glacier to the increasing temperature (more than 10 years) (Oerlemans, 2005) 2nd Third Pole Environment (TPE) Workshop
11a. Glacial lakes Proglacial: moraine dammed Supraglacial: lakes on the glaciers Glacial: lakes not connected with the glaciers Sagarmatha National Park area: ~ 1250 km2 1 lake per 2 km2 (1.4 x 1.4 km) 2nd Third Pole Environment (TPE) Workshop
Changes (% yr-1) among different lake typologies (Double entrance tables) 12b. Glacial lakes 2nd Third Pole Environment (TPE) Workshop
13. Lakes quantity: Summary The Central Himalayan range (Sector 4 South) experiences a constant increased temperature from the beginning of ‘60s until the last recent years: a rate of 0.030 °C yr-1, higher if compared with the mean increasing registered for the Northern Hemisphere(0.013°C yr-1). The glaciers reacted with a slow reduction until ‘90s, while we observed a fast decreasing of their surface in the last period. Considering a constant temperature increase, the speeding up of glaciers can be only explained observing the precipitation reduction. LAKES COULD BE A CLEARERINDICATORS OF CLIMATE CHANGE.Proglacial and Supraglacial lakes seem more dependent on temperature change than lake without direct connections with glaciers. Both of them have increased their surfaces in two periods with the same order of magnitude answering to a constant temperature raise. The number of Supraglacial lakes is also enormously increased (from 213 to 436) in the last period, reacting to an general fragmentation of glacier surfaces occurred in this period. Finally, the lakes without direct connections with glaciers experienced a big reduction reacting to the precipitation decreasing. 2nd Third Pole Environment (TPE) Workshop
14. Lakes quality: preliminary evidences on glacial lakes Upper Pyramid Lake (LCN 9) Sagarmatha National Park Significant correlation between chemical species and the annual mean temperature at the AWS Pyramid Station 2nd Third Pole Environment (TPE) Workshop
15. Lakes quality (physico-chemical and biological) variability MODIS 2009 Tibetan Plateau There are more than 1000 lakes larger then 1 km2 on Tibetan Plateau and several thousands including the surrounding mountain chains. Lakes give an integrated response at basin level (regional answer) to the natural and anthropogenic pressure (integrated answer). Where the local anthropogenic pressure are limited (as TPE) and it is possible to identify using physico-chemical or biological tracers, lakes can help us to measure the integrated and regional effects of global change pressure on the environment as or better than other proxy indicators.
Conclusions Lakes as relevant indicator of climate change impact on quantity, quality and biology of the TPE’s water resources Thanks for your attention The first step of CCQQB Project is concluded assessing the impact of climate change pattern (temperature and precipitation) and its impacts on the glacialised areas. We get first results on effects of climate change on water quality (i.e. increase of dissolved ions) in glacial lakes not affected by suspended particulate matter (clear lakes). Next step is to valuate the cycle of pollutants (as the trace metals, POPs etc.) as anthropogenic indicators of the impact on aquatic ecosystems to understood how their contribution is affecting the biodiversity and functioning of mountain lakes to distinguish by the impacts of climate change. In order to characterise the different patterns of the climate change on water resources in TPE we propose to extend the CCQQB approach to a new reference lakes site in the Tibetan Plateau. 2nd Third Pole Environment (TPE) Workshop