Download
1 / 25
250 likes | 257 Views
The effects of interstate speed limits on driving speeds: Some new evidence. Fred Mannering. Background. Emergency Highway Energy Conservation Act in 1974, mandates the 55 mph national maximum speed limit on interstate highways

E N D
The effects of interstate speed limits on driving speeds: Some new evidence Fred Mannering
Background • Emergency Highway Energy Conservation Act in 1974, mandates the 55 mph national maximum speed limit on interstate highways • National Highway System Designation Act of 1995 that gave states complete freedom to set interstate speed limits • Interstate speed limits now are set 55 mph to 65 mph, 70 mph, or more
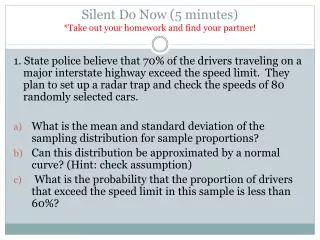
Consequences of higher speed limits: • Many studies concluded the lower 55 mph speed limits saved lives • Kockelman and Bottom (2006): • From 55 to 65 mph results in a 3% increase in the crash rate and a 24% increase in the probability of a fatality once an accident occurred • From 65 to 75 mph resulted in a lower 0.64% increase in the crash rate and in a lower 12% increase in the probability of fatal injury once an accident occurred
Consequences of higher speed limits: • Possible reasons for lower increases with speed limits 65 to 75mph: • Drivers' heightened awareness of risk at higher speeds • Roads assigned the higher 75 mph in their study’s sample may have been inherently safer
Are higher speed limits safer? • Lave and Elias (1994) argue increase from 55 mph to 65 mph saved lives because of: • shifts in law enforcement resources • higher-speed-limit interstates to attract riskier drivers away from inherently more dangerous non-interstate highways • possible reductions in speed variances
Why conflicting safety results? Time varying changes in factors such as: • highway enforcement, • vehicle miles traveled, • vehicle occupancy, • seat belt usage, • alcohol use and driving, • vehicle fleet mix (proportions of passenger cars, minivans, pickup trucks, and sport utility vehicles), • vehicle safety features (increasing adoption of air bags, antilock brakes, other active safety systems), • speed limits on other road classes and in other states, • driver expectations, and driver adjustment and adaptation to risk
Current study: • Focus not on safety but normal speed selection under low-volume conditions • Consider a range of concurrently existing interstate speeds
Effect of Speed Limits on Drivers' Choice of Speed • Individual drivers have an “optimal” speed (In the absence of speed limits) …. trading of safety and speed • In the presence of speed limits, drivers adjust their speeds to account for the risk of detection by law enforcement, respect for the law, etc.
Choice of Speed Following Peltzman (1975), Viscusi (1984), Winston, Maheshri, Mannering (2006) • Individuals maximize driving utility by trading off safety, S, and driving intensity (speed, risk-taking at intersections), s • There will be a marginal rate of transformation (MRT) between S and s.
Speed limit below point A speed S Speed limit above point A speed ● B ● C S* ● A ● U0 E ● D Ss s* s Safety (probability of avoiding an accident) Speed
In this figure: • With no speed limit, Point A is the driver’s optimal speed • With speed limit set belowPoint A, driver selects a new equilibrium Point C, which is likely between Points A and B • With speed limit set abovePoint A, driver selects a new equilibrium Point E, which is likely between Points A and D
Speed limit below point A speed S Speed limit above point A speed ● B ● C S* ● A ● U0 E ● D Ss s* s Safety (probability of avoiding an accident) Speed
Objective: • Empirically study factors that determine selection of Points C and E (speed selection in the presence of speed limits)
Data • Survey of Purdue students and faculty • Key questions: • On an interstate with a 55 mph speed limit and little traffic, about how fast do you normally drive? • On an interstate with a 65 mph speed limit and little traffic, about how fast do you normally drive? • On an interstate with a 70 mph speed limit and little traffic, about how fast do you normally drive?
OF 204 respondents: • 1 person normally drove below the 55 mph speed limit (9 reported they drive at the 55mph speed limit) • 3 people normally drove below the 65 mph speed limit (11 reported they drive at the 65 mph speed limit) • 6 people normally drove below the 70 mph speed limit (20 reported they drive at the 70 mph speed limit)
Methodology • Speed choices under three speed limits • Estimating separate equations would result in inefficient coefficient estimates
Where: • Speed70, Speed65 and Speed55 are the number of miles per hour respondents normally drive above the speed limit (with little traffic) for 70, 65, and 55 mph speed limits • Z is a vector of driver and driver-household characteristics, • X is a vector of vector of driver preferences and opinions, • 's, 's, are vectors of estimable parameters, and • 's are disturbance terms
Use seemingly unrelated regression estimation (SURE) • To account for cross-equation correlation • Instead of • Use generalized least squares
One-tailed t-test results: ** significantly differentfrom zero at more than 95% confidence, * significantly different from zero at more than 90% confidence
Findings (70 mph roads) • Drive faster: • Higher income, • Believe Indiana has good pavement quality, • Believe Germany makes most prestigious cars • Drive slower: • Older, • Number of children under 6 years old, • First licensed at 17 years old or older
Findings (65 mph roads) • Drive faster: • Male • Higher income, • Believe Indiana has good pavement quality • Drive slower: • Older, • Number of children under 6 years old, • First licensed at 17 years old or older, • Believe Japan makes most prestigious cars
Findings (55 mph roads) • Drive faster: • Higher income, • Believe Indiana has good pavement quality, • Believe Germany makes most prestigious cars • Drive slower: • Lower income, • Number of children under 6 years old, • First licensed at 17 years old or older, • Believe Japan makes most prestigious cars
Conclusions • Wide range of socioeconomic factors influence speed choice and the effect of speed limits on it • An expanded sample to take into account the effect of traffic congestion on speed choice could reveal important speed/flow relationships